Figure 7.
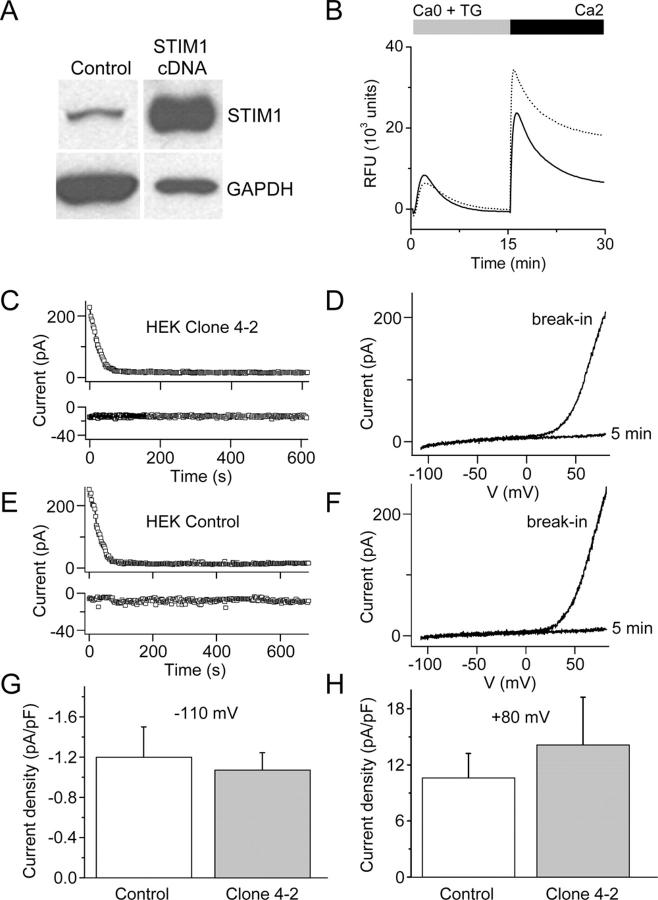
Overexpression of STIM1 in HEK293 cells. (A) Western blot analysis of STIM1 (top band) and GAPDH (bottom band) proteins in HEK-STIM1 (STIM1 overexpressing) cells and control cells (HEK-Zeo cells); lane 1, 10 μg protein; lane 2, 1 μg protein. We estimate STIM1 protein levels to be nearly 100-fold greater than in the HEK-STIM1 cells compared with control cells. (B) Representative traces of TG-induced Ca2+ release and TG-induced Ca2+ entry in HEK-STIM1 cells (dotted line) compared with HEK-Zeo cells (solid line). TG-induced Ca2+ entry was enhanced in HEK-STIM1 cells by an average of 17% in four experiments. (C and E) Time course of outward current at +80 mV and inward current at −110 mV (note different scales) for control HEK-Zeo (E) and HEK-STIM1 cells (C). (D and F) Representative current-voltage relationships immediately after break-in to achieve whole-cell recording and 5 min later in control HEK-Zeo (D) and HEK-STIM1 cells (F). Outwardly rectifying Mg2+-inhibited cation current representing channel activity of TRPM7 disappeared as Mg2+ diffused into the cell from the pipette. (G and H) Inward and outward currents were not significantly altered by overexpression of STIM1; n = 10 cells for each group. Error bars represent SEM.

