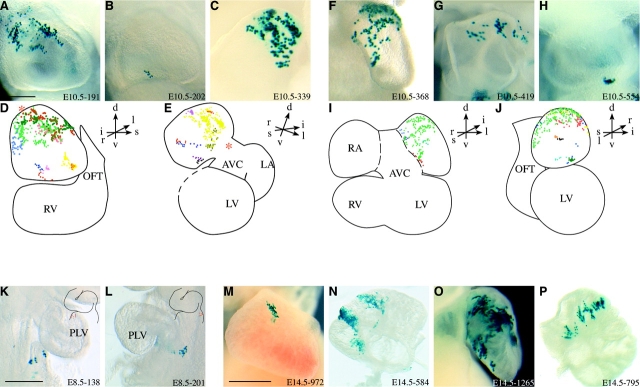
Figure 6.
Clusters of β-galactosidase–positive cells in the atrial appendages. (A–E, K, M, and N) Right atrium. Examples of staining in the right atrial appendage at E10.5 in right lateral (A and B) and ventral (C) views, with a high (A and C) or low (B) number of cells. Schematic representations of an E10.5 heart in the same views (D and E, respectively), showing the clones (n ≥ 5 cells) that were observed in the right atrial appendage, each in a distinct color. The dotted contour in E represents the site of section of the embryonic right ventricle and outflow tract that was removed to permit a direct visualization of the ventral side of the right atrial appendage. Asterisks indicate the point of convergence of the oriented clusters. (K) An example of a clone in the primitive right atrium at E8.5 (right lateral view). The orientation of the clone (in red) is schematized in the inset. (M and N) Examples of clones in the right atrium at E14.5 (M, lateral view; N, ventral view). (F–J, L, O, and P) Left atrium. Examples of staining in the left atrial appendage at E10.5 in superior (F) and left lateral (G and H) views, with a high (F and G) or low (H) number of cells. Schematic representations of an E10.5 heart in the same views (I and J, respectively), showing the clones that were observed in the left atrial appendage, each in a distinct color. The dotted contour in I indicates the limit of the atrial appendages. (L) An example of a clone in the primitive left atrium at E8.5 (left lateral view). The orientation of the clone (in red) is schematized in the inset. (O and P) Examples of clones in the left atrium at E14.5 (O, superior view; P, ventral view).

