
Figure 10.
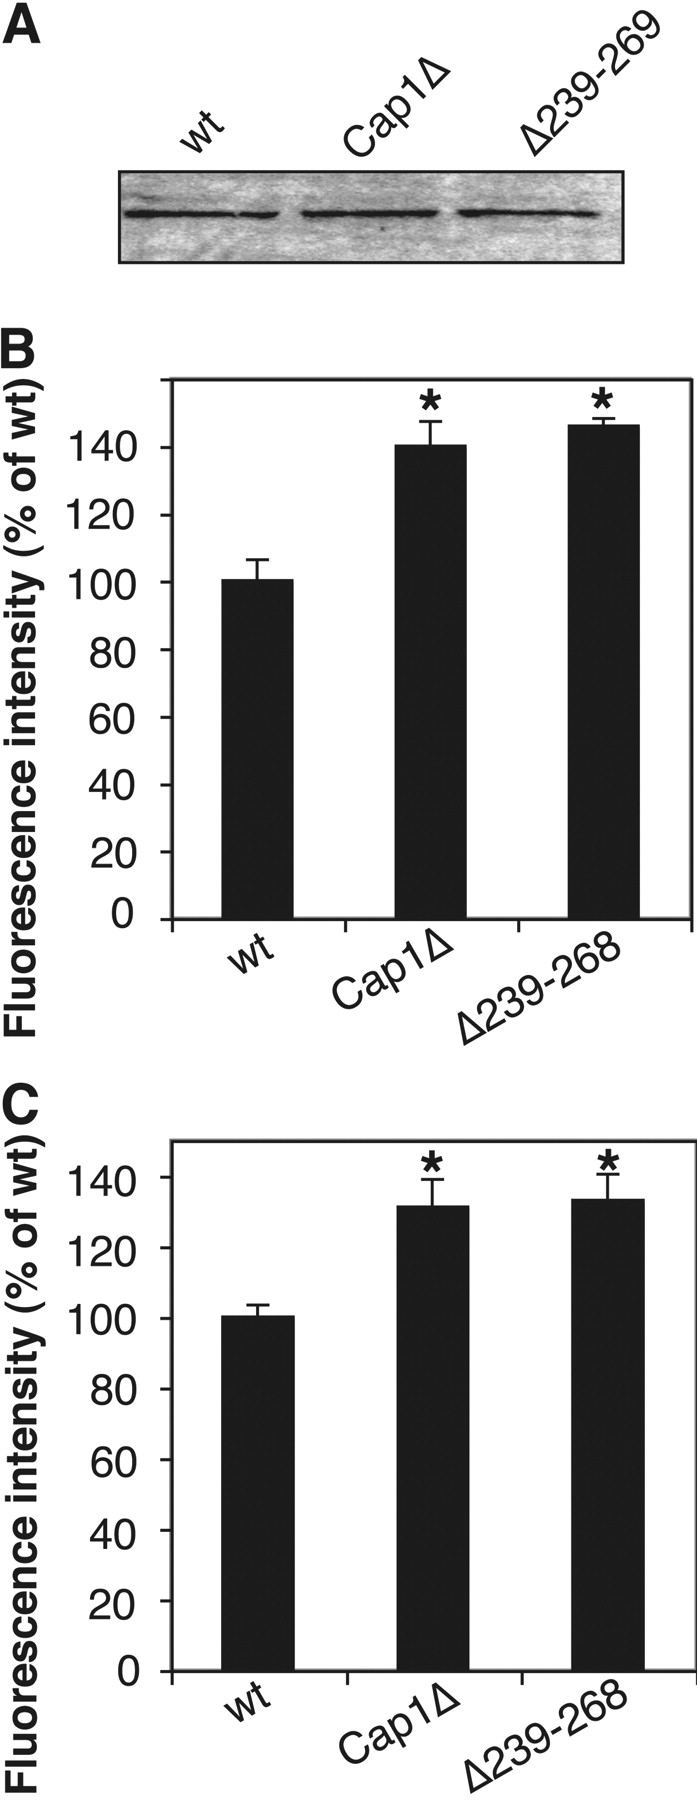
Quantitation of actin in CP mutants. (A) Immunoblot of actin in whole-cell extracts of yeast strains. The same amount (20 μg) of total protein was loaded. (B) Bars represent the mean value of bound rhodamine-phalloidin fluorescence for a cell population measured in a fluorometer. The values for each strain were normalized for total protein content, and wt was set at 100%. (C) Bars represent the mean value of bound rhodamine-phalloidin fluorescence measured for individual cells in a fluorescence microscope. The error bar is SEM. Asterisks marks cases where the difference between the mutant and wt is statistically significant (P < 0.05).