
Figure 9.
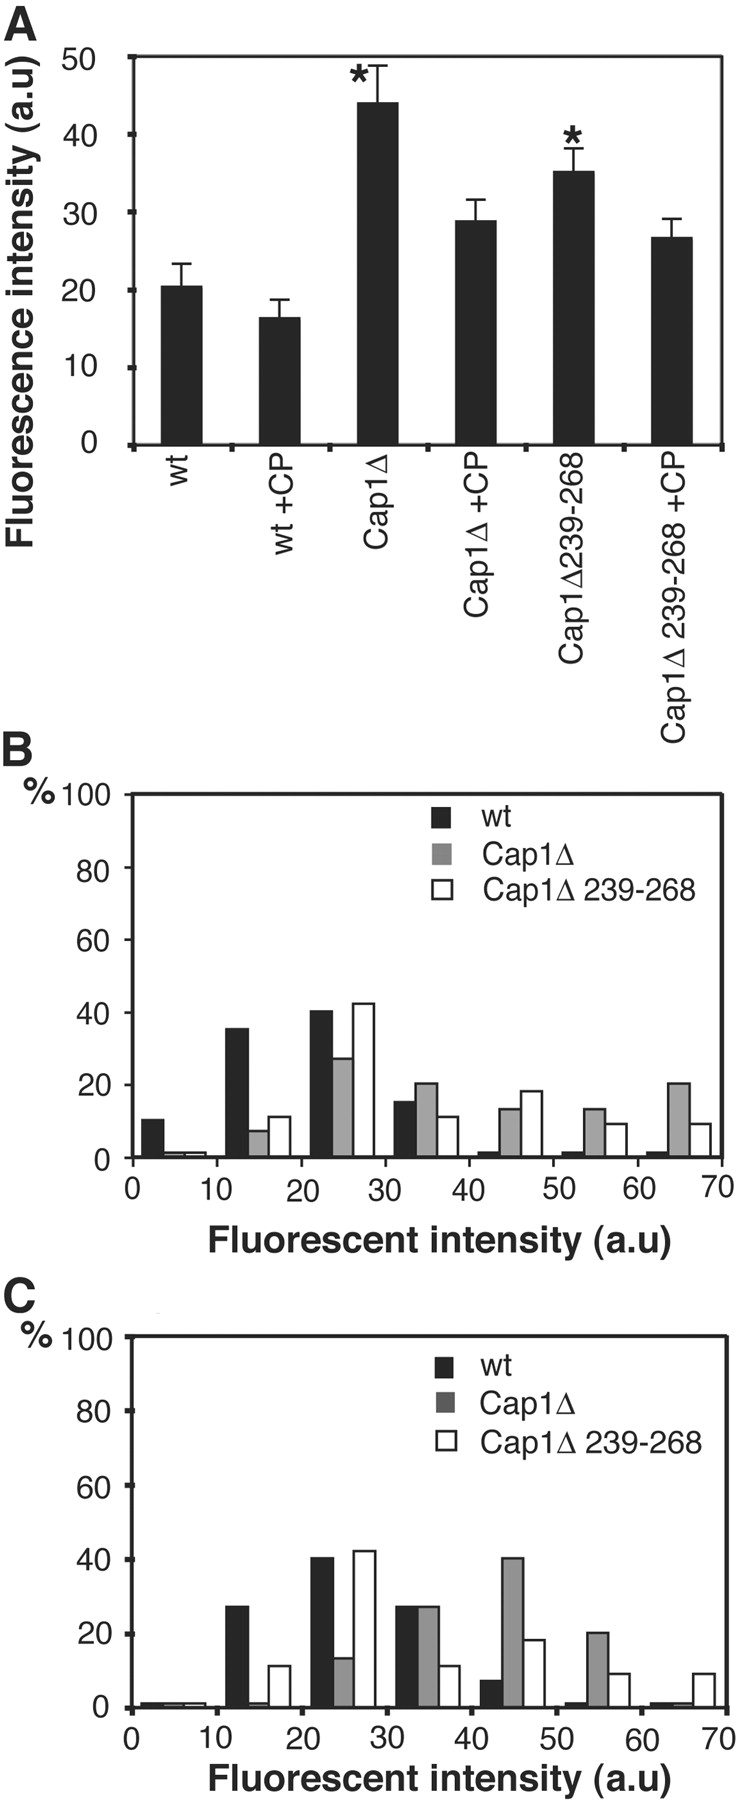
Rhodamine-actin incorporation into permeabilized cells. 0.5 μM rhodamine-actin was added to permeabilized cells for 10 min. Small-budded cells were viewed by fluorescence microscopy. (A) The mean intensity of fluorescence associated with the entire bud was quantified. The error bar is SEM. Asterisks mark cases where the difference between the mutant and wt is statistically significant (P < 0.05). B and C are histograms of the intensity of fluorescence of the entire bud (B) and of individual patches in the bud (C). The unit of fluorescence intensity is arbitrary.