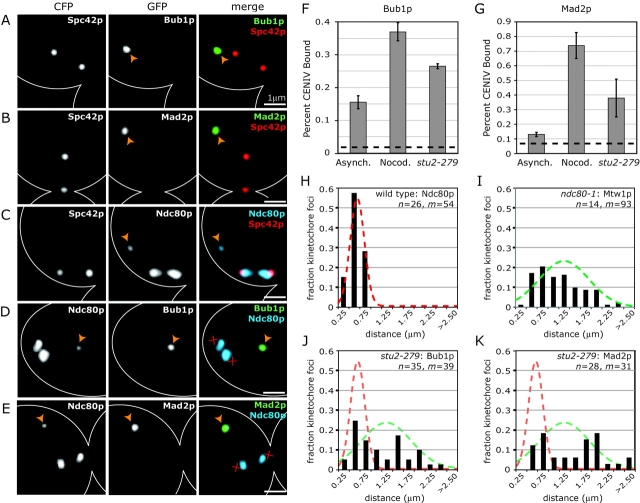
Figure 7.
Bub1p and Mad2p localization in stu2-279 cells. (A–C) stu2-279 cells coexpressing the SPB protein Spc42p-CFP and Bub1p-GFP, Mad2p-GFP, or Ndc80p-GFP. Panels show Spc42p-CFP alone; Bub1p-GFP, Mad2p-GFP, or Ndc80p-GFP alone; and Spc42p-CFP (red) merged with Bub1p-GFP (green), Mad2p-GFP (green), or Ndc80p-GFP (blue). Cells were grown at 25°C to mid-log phase and shifted to 37°C for 2 h before fixation. Orange arrowheads denote unattached kinetochores. (D and E) stu2-279 cells coexpressing the kinetochore protein Ndc80p-CFP and Bub1p-GFP or Mad2p-GFP. Panels show Ndc80p-CFP alone; Bub1p-GFP or Mad2p-GFP alone; and Ndc80p-CFP (blue) merged with Bub1p-GFP (green) or Mad2p-GFP (green). Images are as described in Fig. 1 A. Red X's denote the inferred positions of SPBs. (F and G) ChIP of Bub1p-GFP and Mad2p-GFP at CENIV in asynchronous wild-type cells, nocodazole-treated wild-type cells, and stu2-279 cells, all at 37°C. Graphs are as described in Fig. 1 (D–G). (H–K) Spatial distribution of kinetochore protein foci for (H) Ndc80p-GFP in wild-type cells with attached kinetochores, (I) Mtw1p-GFP in ndc80-1 cells with unattached kinetochores (at 37°C), and (J and K) Bub1p-GFP or Mad2p-GFP in stu2-279 cells (also at 37°C). Distances were measured from each GFP focus to the center of the spindle. Spindle orientation and length was determined using Spc42p-CFP. Only cells with spindles between 0.75 and 1.50 μm were included. Lines represent normal distributions for attached (red, μ = 0.40 μm; σ = 0.15) or unattached kinetochores (green, μ = 1.01 μm; σ = 0.52). The number of cells (n) and number of kinetochore foci (m) analyzed are listed on each graph.

