
Figure 4.
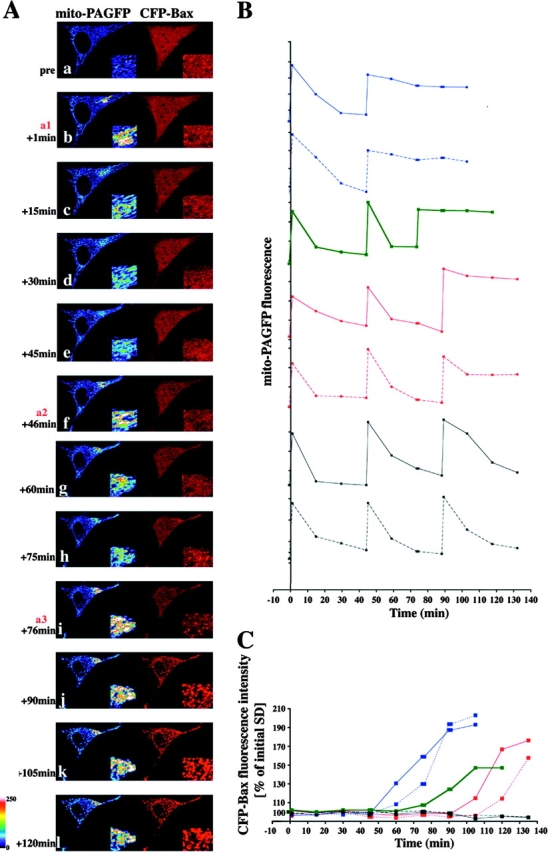
Inhibition of mitochondrial fusion upon mitochondrial activation of Bax. (A) HeLa cells were cotransfected with mito-PAGFP (pseudocolored) and CFP-Bax (red), treated with 75 μM zVAD-fmk, and, after addition of 1 μM STS, followed by the sequential photoactivation of selected regions (a1, a2, and a3) and acquisition of serial images. In the example shown, two sequential photoactivations (b and f) are followed by an efficient fusion and redistribution of mito-PAGFP. After 76 min following the addition of STS (i), when mitochondrial Bax translocation became evident, there was no matrix exchange indicating inhibition of mitochondrial fusion. Insets show magnified mito-PAGFP and CFP-Bax fluorescence within photoactivated area of the cell. (B) Changes in the average fluorescence intensities of mito-PAGFP in representative cells after STS addition and serial photoactivations as in A. (C) Homogeneity of CFP-Bax, reflecting activation and clustering of Bax (see Materials and methods) within cells shown in B, were measured over time and plotted against the time. The same color and pattern lines in B and C were obtained from the same cells. Dynamics of mitochondrial fusion and Bax coalescence of the cell shown in A is depicted by the green lines in B and C. Note correlation of the time of Bax translocation and mitochondrial fusion inhibition in each case.