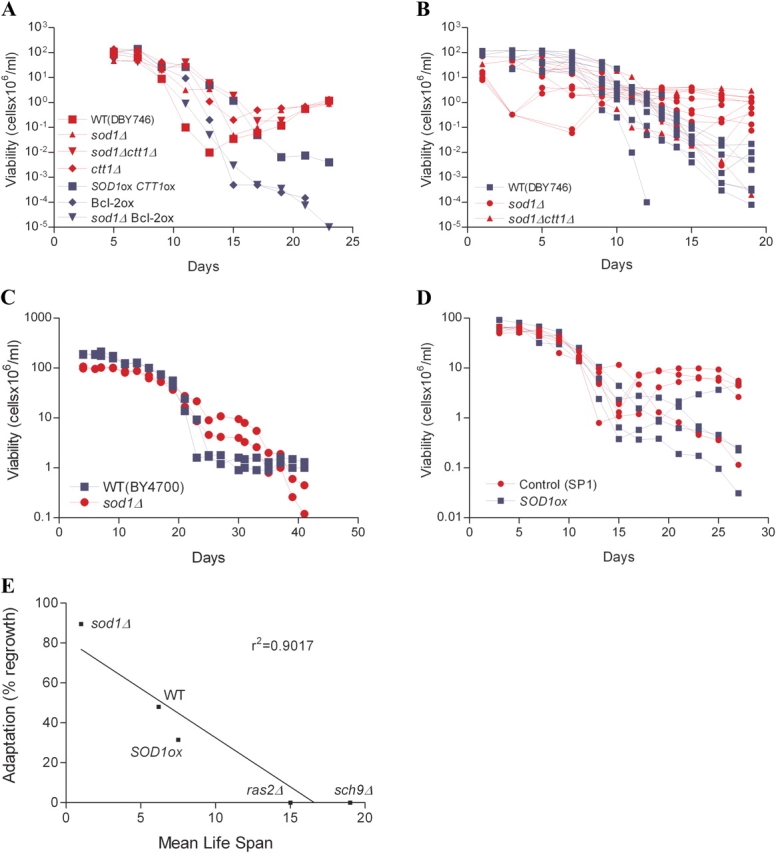
Figure 3.

Adaptive regrowth in short- and long-lived strains. Red lines and symbols are used for strains that have a regrowth advantage relative to the other strain(s) (blue) in that experiment. (A) The ability to regrow after the majority of the population had died was monitored in various wild-type (WT DBY746 and control strain YEp351-YEp352), short-lived mutants lacking cytosolic Sod (sod1Δ and sod1Δ ctt1Δ), and long-lived strains overexpressing antioxidant enzymes or the antiapoptotic mammalian protein Bcl-2 (SOD1ox CTT1ox and Bcl-2ox). sod1Δ mutants overexpressing Bcl-2 and ctt1Δ mutants were also included in the study. A single representative experiment is shown (see Table I for all experiments). (B) Adaptive regrowth was monitored in DBY746 wild-type (blue line) and short-lived strains (sod1Δ and sod1Δ ctt1Δ; red line). Results from four different experiments are plotted. Each line represents a single sample. A total of 8 wild-type samples, 11 sod1Δ, and 3 sod1Δ ctt1Δ is shown. (C) Adaptive regrowth of wild-type strain BY4700 and of a sod1Δ mutant originated in the same background. The experiment was performed three times in duplicate. A representative experiment is shown. (D) Adaptive regrowth of wild-type strain SP1 and of SOD1 overexpressors originated in the same background. A representative experiment is shown. (E) Correlation between adaptive regrowth and mean life span (r = 0.90).
