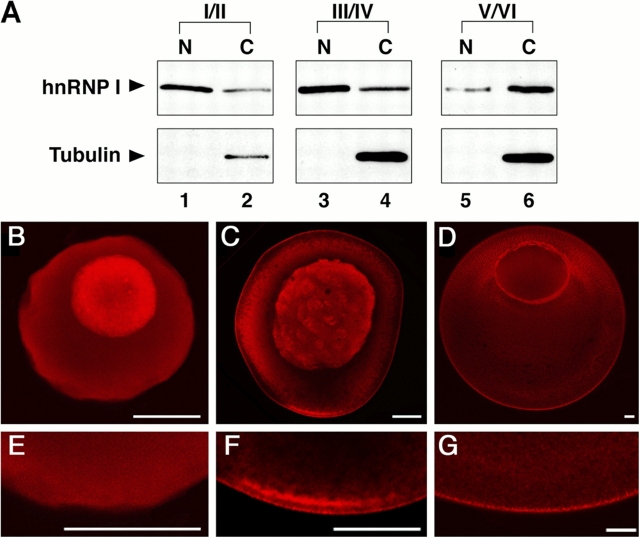
Figure 1.
Subcellular distribution of hnRNP I during oogenesis. (A) Immunoblot analysis of nuclear (lanes 1, 3, and 5) and cytoplasmic (lanes 2, 4, and 6) lysates from stage I/II (lanes 1 and 2), stage III/IV (lanes 3 and 4), and stage V/VI (lanes 5 and 6) oocytes using anti-hnRNP I (top) and anti-tubulin (bottom). (B–G) Whole-mount immunofluorescence using anti-hnRNP I to detect distribution of hnRNP I in stage I/II (B and E), stage III/IV (C and F), and stage V/VI (D and G) oocytes. E, F, and G are higher magnification images of the vegetal pole of oocytes from B, C, and D, respectively. Confocal images were obtained on a microscope (LSM 410; Carl Zeiss MicroImaging, Inc.). Bars, 50 μm.

