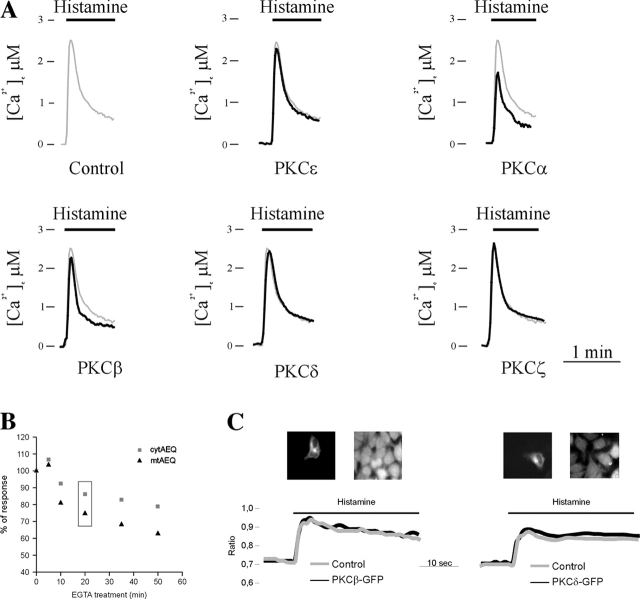
Figure 3.
Cytosolic Ca 2+ homeostasis in control and PKC-overexpressing HeLa cells. (A) Aequorin measurements: parallel batches of HeLa cells were either cotransfected with cytAEQ and a PKC-GFP chimera including the indicated PKC isoform or transfected with the cytAEQ alone (Control). All other conditions were as in Fig. 1. Where indicated, the cells were challenged with 100 μM histamine. (B) Relationship between cytosolic and mitochondrial Ca2+ responses: parallel batches of HeLa cells were transfected with either the cytAEQ or the mtAEQ chimera. All other conditions were as in Fig. 1. To reduce the [Ca2+]c and [Ca2+]m responses, the Ca2+ stores were partially depleted by preincubating the cells in KRB/EGTA for different periods (as indicated) before challenging them with 100 μM histamine. [Ca2+]c and [Ca2+]m responses are expressed as a percentage of the peak amplitude (compare with control, non-EGTA–pretreated cells). The inset highlights the condition in which the reduction of the [Ca2+]c response is the same of that observed on PKC overexpression. (C) Fura-2 measurements: HeLa cells transfected with PKCβ-GFP or PKCδ-GFP (top) and loaded with fura-2 were stimulated with 100 μM histamine. The kinetic behavior of the [Ca2+]c response (bottom) is presented as a 340:380 nm ratio.

