
Figure 6.
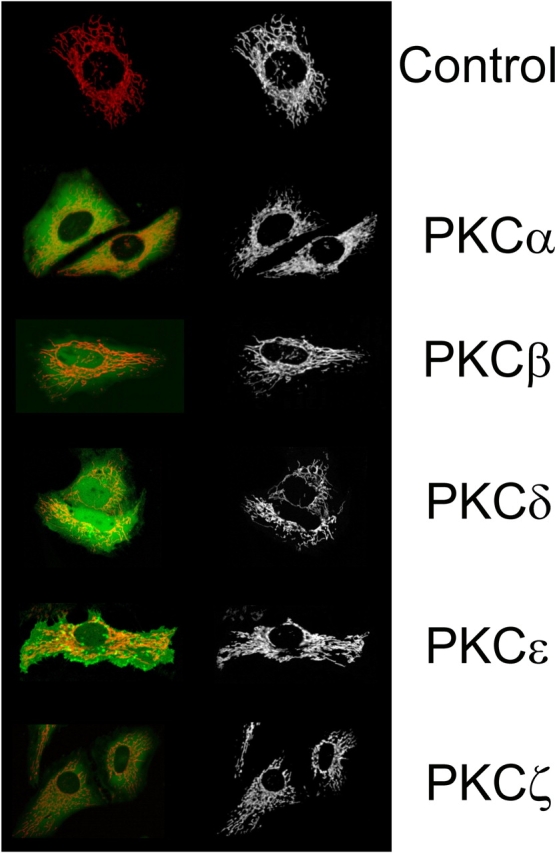
Analysis of mitochondrial structure in PKC-overexpressing cells. HeLa cells were transfected with the PKC-GFP chimera including the indicated PKC isoform and loaded with 10 nM TMRM. Transfected cells were identified by visualizing GFP fluorescence (right), and mitochondrial structure was visualized with TMRM (left) as specified in Materials and methods. The field of cells is representative of >50 observations from at least 5 independent experiments.