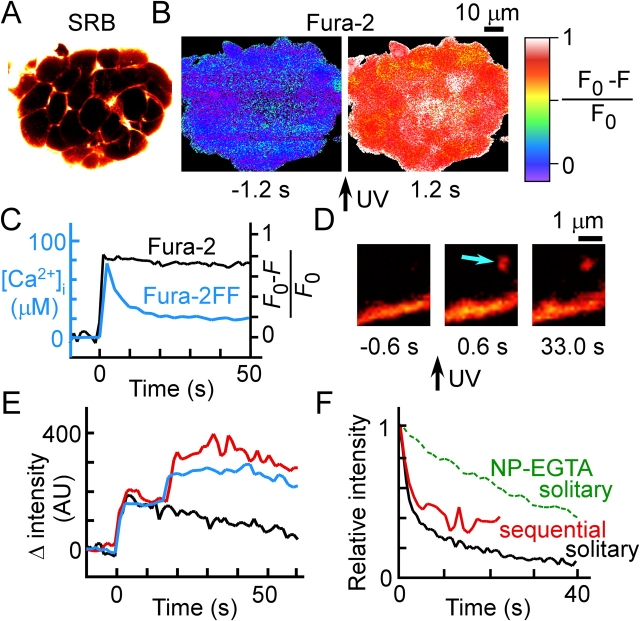
Figure 3.
Exocytic events triggered by photolysis of a caged-Ca2 + compound. (A) SRB fluorescence image of an islet that had been preloaded with NP-EGTA and fura-2. (B) Fura-2 (Ca2+) images obtained 1.2 s before and after UV irradiation of the islet shown in A. (C) Representative time courses of normalized fura-2 fluorescence (black) and of [Ca2+]i estimated with fura-2FF (blue). Fura-2 fluorescence (F) was normalized by the resting fluorescence (F0), and the trace shown is for the islet in B. (D) Exocytic event (arrow) triggered by UV photolysis of NP-EGTA. Ω Profiles often persisted for tens of seconds. (E) Two examples of time courses of sequential exocytosis (blue and red) and an example of that of solitary exocytosis (black) triggered by photolysis of NP-EGTA. The traces were aligned at the onset of exocytosis. (F) Time courses of the decay of SRB fluorescence associated with exocytic events induced by 20 mM glucose (black and red) or by photolysis of NP-EGTA (green). The traces are averages of >10 exocytic events, which were aligned at the peak of SRB fluorescence and normalized by the peak intensity. The data correspond to solitary events (black and green) or to the primary event of sequential exocytosis (red).

