
Figure 7.
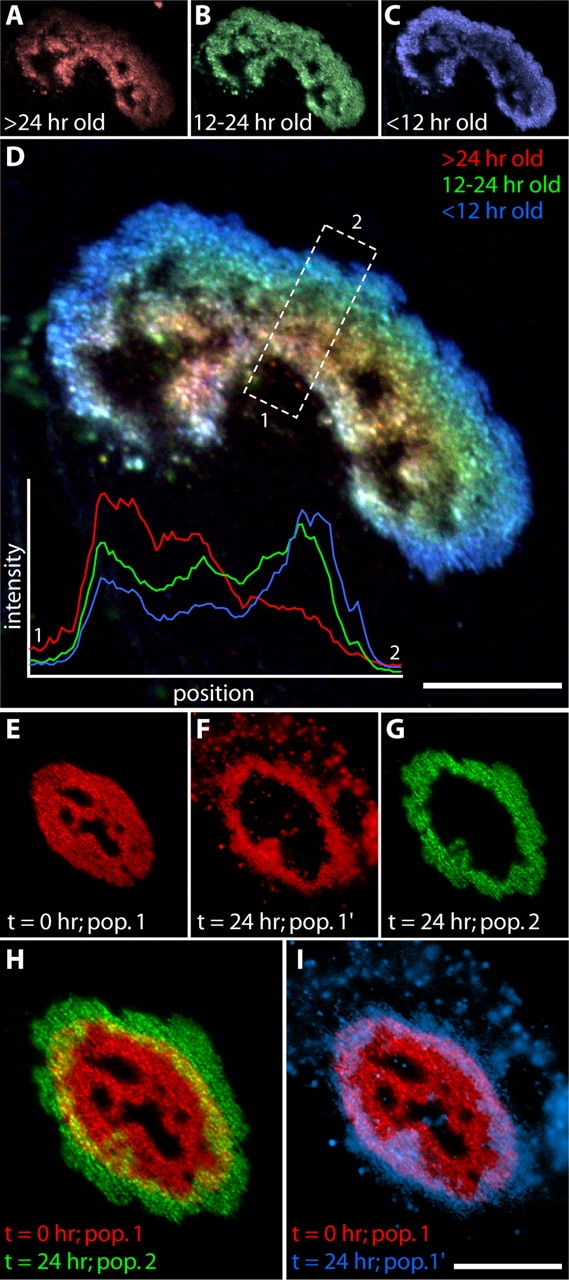
Patterns of AChR addition to aneural aggregates. (A–D) Circumferential addition of AChRs. Myotubes cultured on a laminin-coated substrate were stained with Alexa 594–Btx at 5 d after fusion (A, red), incubated 12 h, restained with Alexa 488–Btx (B, green), incubated an additional 12 h, and then stained with Alexa 647–Btx (C, blue) and imaged. Thus, each color marks AChRs that have spent a different amount of time in the membrane. Overlay (D), emphasizes the distinct distribution of each population: the oldest receptors (red) are most central, whereas the youngest (blue) are most peripheral. Inset in D shows relative intensities of the three labels in the boxed region. (E–I) Limited AChR mobility within aggregates. Cultures were stained with Alexa 594–Btx and imaged immediately (E, pop. 1). After 24 h, the cultures were stained with Alexa 488–Btx and both the original population (F, pop. 1′) and the new population (G, pop. 2) of AChRs were imaged. Overlay of population 1 (t = 0) and population 2 (t = 24 h) illustrates the growth of the AChR aggregate (H). Despite this growth, the lateral extent of the original population changed little (I; pop. 1′ is pseudocolored blue). Numerous AChR-rich vesicles near the aggregate (F and I) may indicate endocytotic removal of AChRs. Bars: (D and I) 20 μm.