
Figure 7.
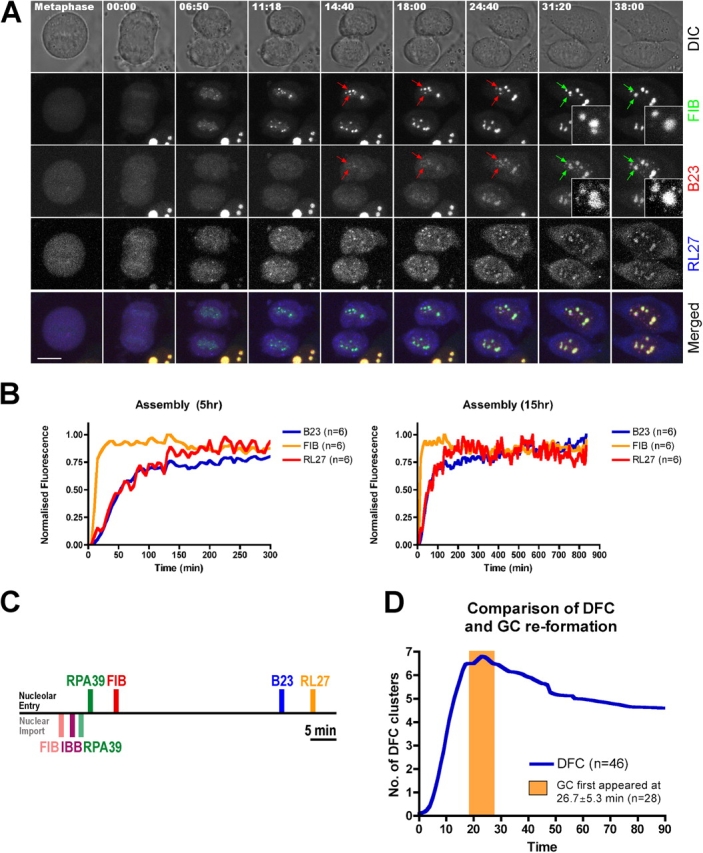
The reassembly of functional nucleoli. (A) HeLaYFP-FIB+CFP-B23 cells were transiently transfected with DsRed2-RL27 for 16 h before imaging. The time shown on the top of the panel indicates the time for the cell progressing through mitosis and 00:00 indicates the beginning of chromosome migration toward its respective pole. Bar, 5 μm. Pairs of arrows were used to follow two reforming NORs to form a single nucleolus and the color changes from red to green to represent the fusion events. (B) The mean fluorescence intensities of the nucleolar components FIB, B23 and RL27 within nucleoli were averaged, normalized and plotted over 5 (left) and 15 h (right) in the same manner as in Fig. 6 D. The distribution of the original data is reported in Fig. S2. (C) Collating data from Figs. 6 and 7, a possible time line to summarize the relationship between different nucleolar subcompartments and nuclear import markers, is proposed. The top side indicates the time for different nucleolar components to reassemble into nucleoli, whereas the bottom side indicates the time required for nucleolar markers RPA39 and FIB as well as nuclear import markers IBB to enter nucleoli after mitosis. The time line begins at 00:00 when the chromosomes start to migrate toward its respective pole. For nucleolar entry, RPA39, FIB, B23, and RL27 reach 50% of its saturated value at 14:42, 19:00, 53:00, and 60:00, respectively. For nuclear import, FIB, IBB, and RPA39 reach 50% of its saturated value at 09:06, 11:18, and 13:48, respectively. Bar, 5 min. (D) The number of clusters represented by the DFC marker FIB was counted and plotted against time, where time equals 00:00 when the chromosomes start to migrate toward its respective pole and n = the number of cells examined. An orange window was added in the same time scale to denote the first appearance of GC within the reforming nucleoli. The distribution of the original data counting the number of DFC clusters is reported in Fig. S3 A (available at http://www.jcb.org/cgi/content/full/jcb.200405013/DC1).