Figure 3.

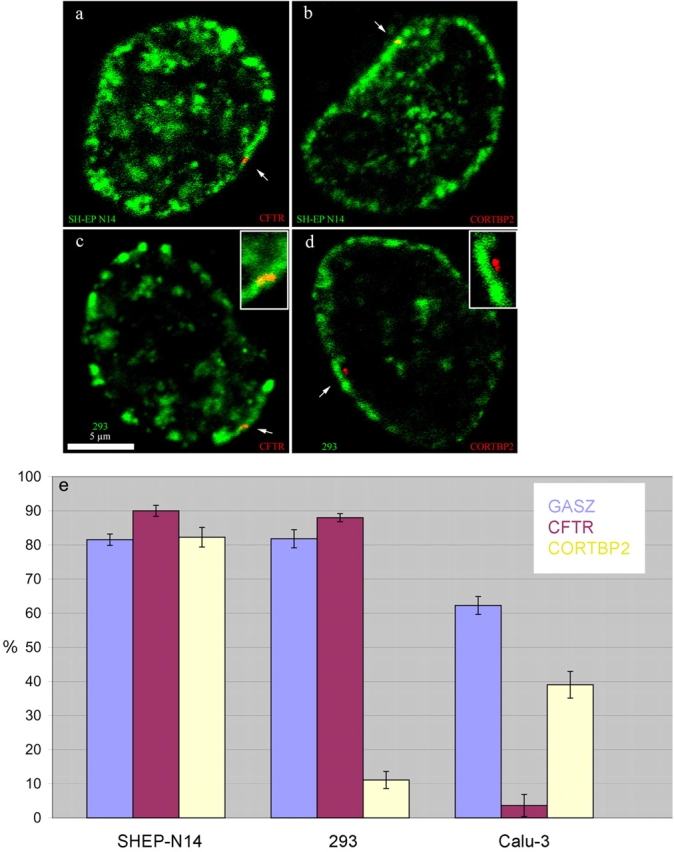
Spatial arrangements of GASZ, CFTR, and CORTBP2. (a–d) Panels show light-optical sections of formaldehyde-fixed nuclei from SH-EP N14 (a and b) and HEK 293 (c and d) cells (bar, 5 μm). CFTR (a and c) and CORTBP2 (b and d) were detected by FISH (red signals). Perinuclear and perinucleolar heterochromatin has been visualized by replication labeling (green). The arrows in a, b, and c, respectively, point to CFTR and CORTBP2 genes embedded within the perinuclear heterochromatin. The arrow in d points to the CORTBP2 locus (doublet signal) localizing within the adjacent euchromatin. The insets in c and d show the corresponding FISH signals and their nuclear environments enlarged. (e) The fractions of FISH signals (violet bars, GASZ; red bars, CFTR; yellow bars, CORTBP2; average ± SD) colocalizing with perinuclear heterochromatin were determined in the cell types indicated. Replication-labeled nuclei as shown in panels a–d were evaluated after FISH. In each case ∼50–60 FISH signals were evaluated.
