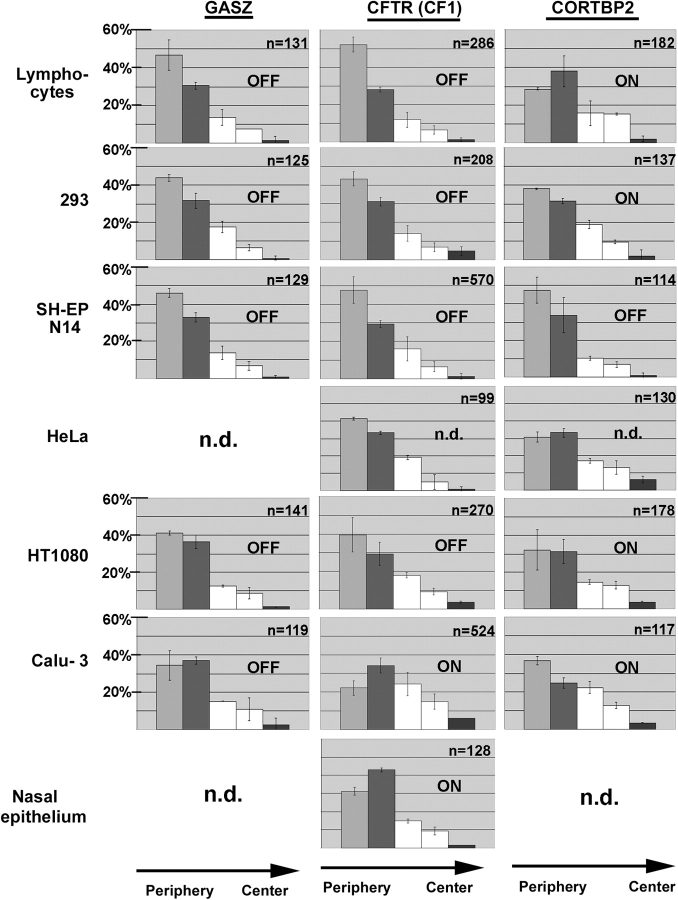
Figure 4.
Summary of the erosion analysis results. Nuclei of the seven cell types indicated were hybridized with probes specific for GASZ (left-hand diagrams), CFTR (diagrams in the middle), and CORTBP2 (right-hand diagrams). Nuclei were imaged by epifluorescence microscopy and the 2D image of each nucleus was subdivided into five concentric areas with each area having a thickness of 20% of the nuclear radius as defined by the DAPI counterstain. The positions of FISH signals with regard to these five areas were determined. The five bars in each diagram indicate the fractions of FISH signals in the five concentric areas (average ± SD). The very left bar in each diagram corresponds to the most peripheral area (1), whereas the right bars correspond to the central area (5). For each combination (gene and cell type), 2–8 independent experiments have been performed. n indicates the number of FISH signals evaluated. In addition, on each panel it is indicated whether the gene analyzed was transcriptionally active (on) or inactive (off), as revealed by the RT-PCR analyses (Table I).

