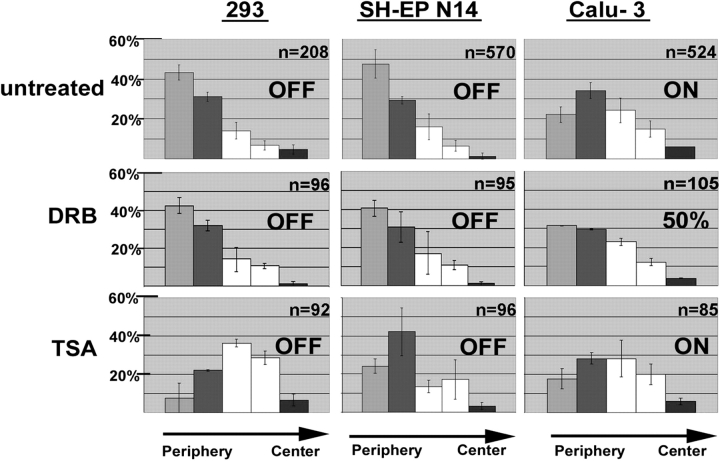
Figure 7.
Positioning of CFTR after DRB and TSA treatment. FISH was performed with the CF1 probe on the cell types indicated. Cells were treated with the transcriptional inhibitor DRB or the histone deacetylase inhibitor TSA. For comparison, the results obtained for untreated cells are also included. The localization of FISH signals was determined by erosion analysis. The erosion analysis was performed and the corresponding diagrams were arranged as described in the legend of Fig. 4. In addition, on each panel it is indicated whether the gene analyzed was transcriptionally active (on) or inactive (off), as revealed by RT-PCR analysis. The level of CFTR transcription in Calu-3 cells was reduced to ∼50% after DRB treatment (Table I).

