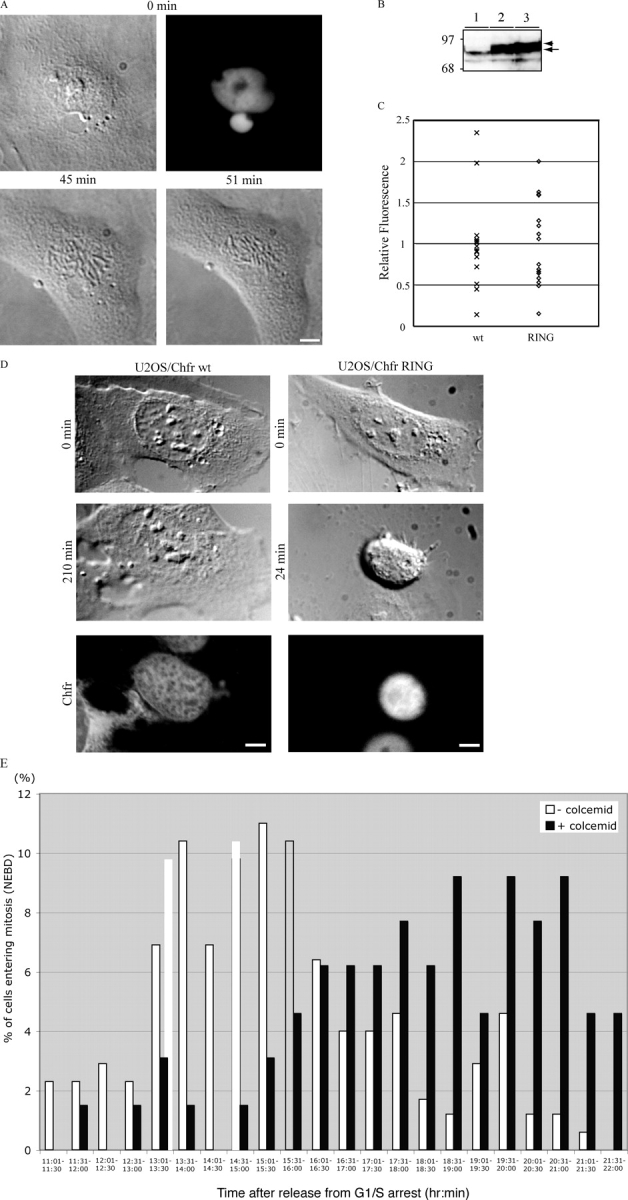
Figure 2.

Chfr is required for the antephase checkpoint. (A) Fluorescence (top right) and DIC images of Ptk1 cell expressing a GFP tagged ΔFHA mutant of Chfr. The cell was treated with 15 μM colcemid at 0 min (top left) and continued on into mitosis (bottom panels). The complete series of DIC images are presented in Quicktime format as Video 2. (B) Anti-Chfr immunoblot of tetracycline-inducible Chfr cell lines. (lane 1) Uninduced cells; (lane 2) cells expressing epitope-tagged wild-type Chfr; (lane 3) cells expressing epitope-tagged RING-finger mutant of Chfr. Epitope-tagged Chfr is marked by the arrowhead, endogenous Chfr is marked by the arrow. Molecular mass markers are indicated on the left. (C) Box plot of the relative fluorescence intensities of individual U2OS cells of the stable cell lines expressing inducible Chfr proteins. Cells were stained with anti-Xpress epitope antibody to detect wild type (wt, n = 15) or the Ring finger mutant (RING, n = 16) of Chfr. (D) DIC images of U2OS cell lines expressing an inducible wild type (left) or a RING finger mutant (right) of Chfr were treated with 15 μM colcemid at 0 min (top). Cells expressing wild-type Chfr decondensed their chromosomes and returned to antephase for least 3.5 h (middle left). In contrast, cells expressing mutant Chfr continued on into mitosis (middle right). Cells were then fixed and stained with anti-Xpress tag antibody to assay for expression of the ectopic Chfr (bottom). Bar, 10 μm. The complete series of images are presented in Quicktime format for the cell expressing wild-type Chfr as Video 3 and for the RING finger mutant as Video 4. (E) Colcemid delays mitosis in U2OS cells expressing wild-type Chfr. Synchronized U2OS cells expressing wild-type Chfr from an inducible promoter were treated or not with 15 μM colcemid in G2 phase. Cells were monitored by time-lapse microscopy, and the time at which they broke down their nuclear envelopes was plotted as a frequency histogram. Cells are representative of two separate experiments. Videos are available at http://www.jcb.org/cgi/content/full/jcb.200401139/DC1.
