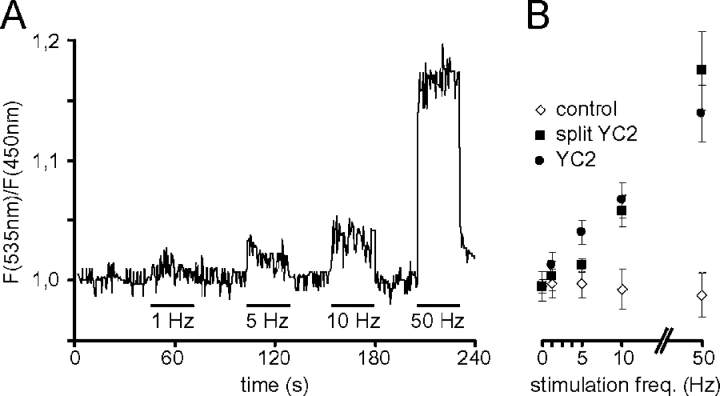
Figure 3.
Calibration of the YC2 response to stimulation frequency. Trains with different stimulation frequencies ranging from 1 to 50 Hz were applied as indicated to tibialis anterior muscle expressing either YC2 (A and B), split YC2 (B), or a combination of ECFP-CaM and EYFP (B, control), and the response was monitored in situ by two-photon microscopy. (A) Time course of the YFP/CFP ratio values of a representative calibration experiment. (B) Graph showing the mean YFP/CFP ratio as a function of stimulation frequency. Shown are mean YFP/CFP ratio values of the analyzed images for each stimulation frequency. Error bars show ± SD. All data points are derived from at least two different mice and four different fibers.

