
Figure 3.
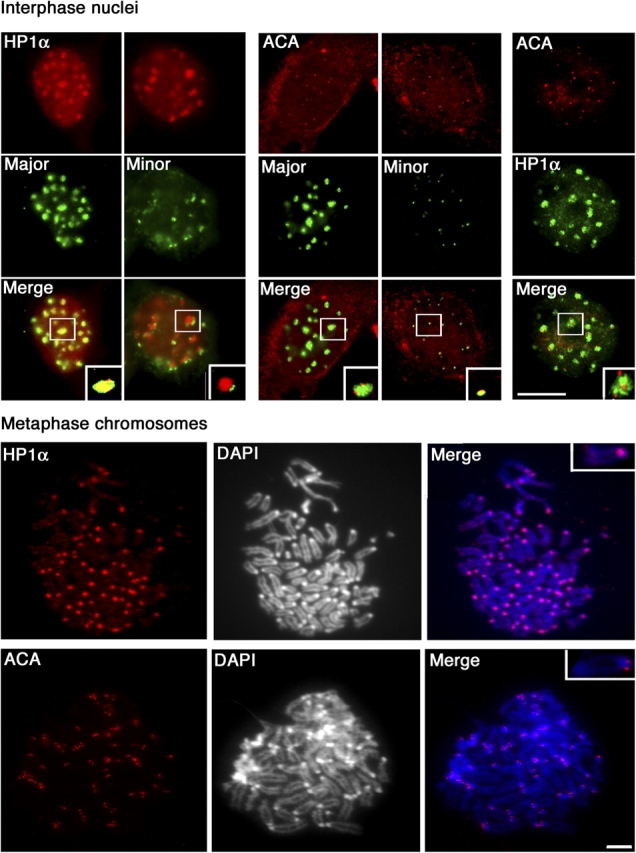
Major and minor satellite-specific marks in interphase and metaphase nuclei. Interphase: (left) HP1α (red) and major and minor DNA (green). (middle) ACA (CENP-A, B, C) is presented in red, major and minor DNA in green. (right) Costaining with ACA serum (red) combined with anti-HP1α antibodies (green). A close-up of selected foci (inset in the merged images). Metaphase: DNA was visualized with DAPI and protein staining in red. Double labeling is shown in merged images. A close-up of a chromosome selected (inset in the merged images). Bars, 5 μm.