
Figure 5.
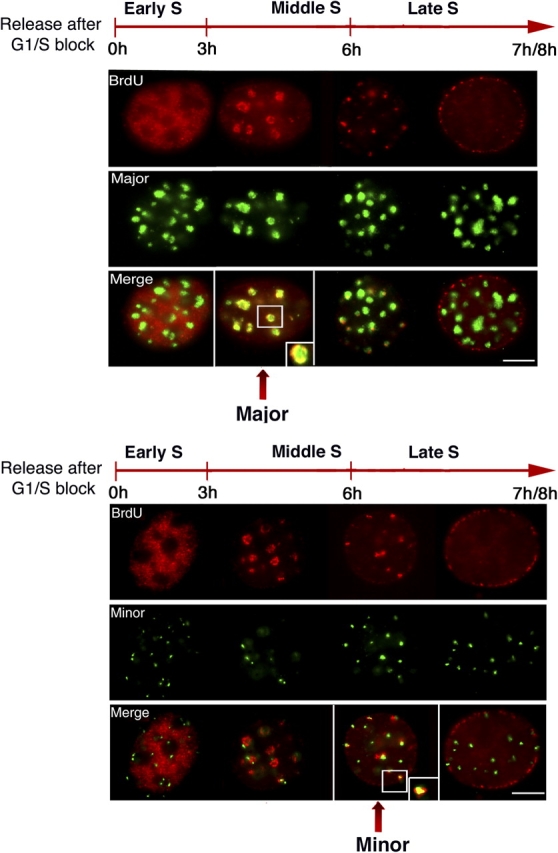
Replication timing of major and minor satellites during S-phase. Synchronized NIH 3T3 cells into S-phase were pulse labeled with BrdU for 10 min at the indicated times after release and stained for incorporation (BrdU, red) combined with DNA FISH (green) either for major (top) or minor satellites (bottom). Colocalization of BrdU staining with major or minor satellite DNA is presented in merged images. A close-up of a selected chromosome is shown (inset). Bars, 5 μm.