
Figure 6.
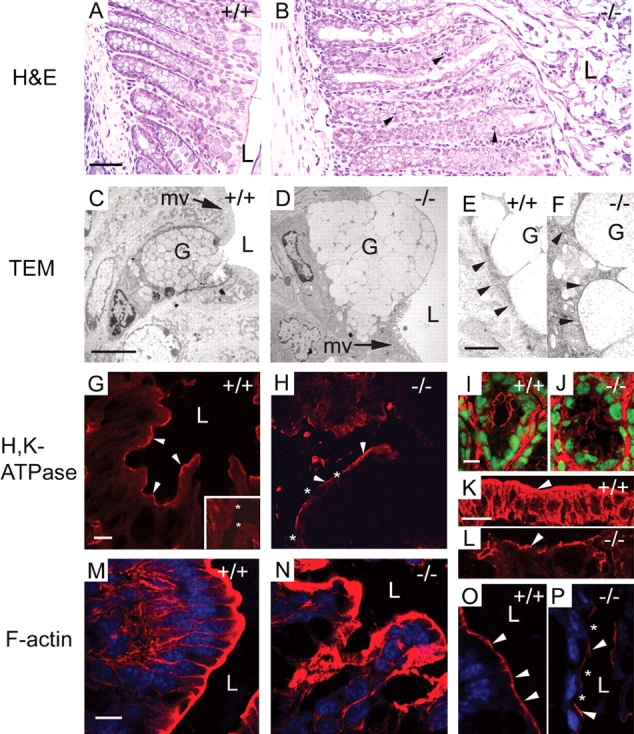
Histologic, ultrastructural, and staining analysis of K8+/+ and −/− mouse distal colon. K8+/+ and K8−/− distal colons were fixed then stained with hematoxylin and eosin (H&E; A and B), analyzed by transmission electron microscopy (TEM; C–F), or examined by immunofluorescence single or double staining to visualize H,K-ATPase (red, G–J; with nuclei stained green in I and J), K19 (red, K and L), F-actin (red, M–P; with nuclei stained blue in M–P). (A and B) Arrowheads in B highlight mitotic cells. Bar, 50 μm. L, lumen. (C–F) Arrowheads in E and F highlight keratin bundles that are present in K8+/+ (E) but absent in K8 −/− (F) mice. G, goblet cell; mv, microvilli. Bars: (C and D) 0.5 μm; (E and F) 0.05 μm. (G–J) H,K-ATPase in K8+/+ is uniformly distributed at the apical membrane of distal colon enterocytes (arrowheads in G) but is absent in the proximal colon (inset of G with asterisk highlighting apical membrane). I and J show H,K-ATPase staining at the basal regions of the crypts. Bars: (G and H) 0.05 μm; (I and J) 10 μm. The Ab also stains nonepithelial cells in the submucosa. (K and L) Arrowheads highlight the luminal apical membrane. Bar, 10 μm. (M–O) Panels O and P were obtained with identical but lower confocal laser intensity than M and N in order to visualize the uniformity (arrowheads in +/+ and −/−) versus the patchiness (asterisks in −/−) of F-actin distribution. Notably, all staining (G–P) is specific since using only second-stage antibodies on colons of +/+ or −/− mice was essentially blank (not depicted). Bar, 10 μm.