
Figure 4.
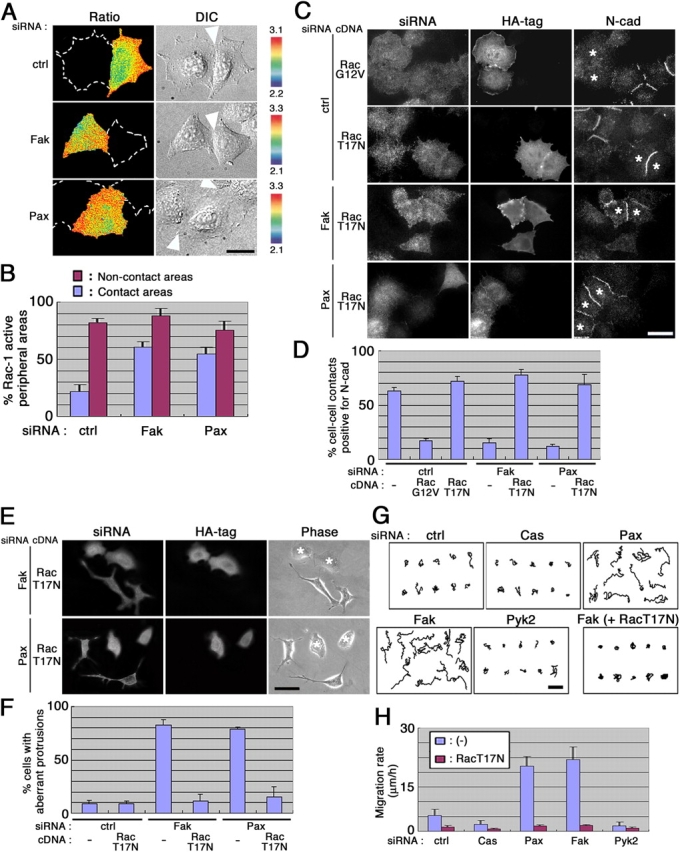
Fak and paxillin participate in the down-regulation of Rac1 activity in motile HeLa cells. (A) FRET imaging of Rac1 activity. siRNA-treated cells were transfected with pRaichu-Rac and were replated onto collagen at a sparse density. Ratio images of YFP/CFP representing the FRET efficiency for Rac1 activity were then obtained with live cells within 15 min to 1 h after replating, as described in Materials and methods. The upper and lower limits of the ratio range are shown on the right side. Dashed lines indicate the contours of contacting adjacent cells. Differential interference contrast images (DIC) are also shown. Arrowheads indicate cell–cell contact sites. Bar, 30 μm. (B) Statistical representation of the Rac1 FRET imaging results. Rectangles, each 5 × 30 μm in size, were fitted onto the cell peripheries of the FRET images, as shown in A, and numbers of the rectangles in which >80% were taken up by signals with the ratio range within the highest two classes (2.85–3.1 for ctrl, and 3.0–3.3 for Fak and Pax) were scored as “Rac1-active peripheral areas.” Percentages of the “Rac1-active” rectangles with regard to the contact areas or noncontacting areas are shown, in which >80 rectangles were examined in each case. Percentages of the Rac1-active rectangles of the noncontact areas were similar to those measured with isolated cells (not depicted). (C–F) Effects of expression of Rac1 mutants on N-cadherin staining at cell–cell junctions (C and D) and formation of aberrant protrusions (E and F) in siRNA-treated cells. Cells were cotransfected with Cy3-labeled siRNAs and empty vector (−), and with HA-tagged Rac1G12V or Rac1T17N cDNAs, as indicated. They were then replated at a sparse density and incubated for 3 h, and were subjected to immunostaining for the HA tag and N-cadherin. Cells incorporated siRNAs were identified by Cy3. Cells positive for the HA tag were marked by asterisks in the right panels. Bars (C and E), 50 μm. Statistical representation of the results is shown (D and F) in which >30 cells double positive for siRNAs and Rac cDNAs were counted in each of the three independent experiments. Error bars, SEM. (G and H) Enhanced migration by knockdown of Fak or paxillin, and its suppression by Rac1T17N. Cells, transfected with siRNAs, or siRNAs and Rac1T17N cDNA, were replated onto collagen and subjected to time-lapse video recording for 3 h in the absence of serum. Cell migration was traced (G), and migration rates (μm/h) are shown (H). 20 knockdown cells were examined in each of the three independent experiments. Error bars, SEM. Transfection of siRNAs and Rac1T17N in each cell was confirmed by immunostaining after the video recording. Bar, 100 μm. Abbreviations are the same as in Fig. 1 unless otherwise indicated.