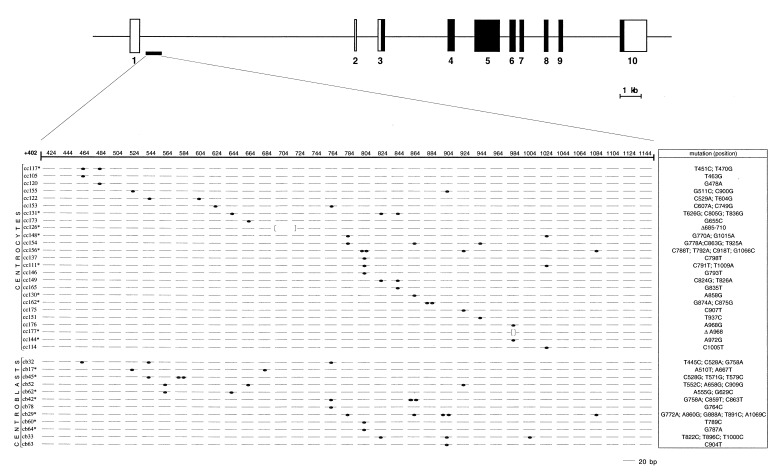
Figure 1.
Distribution of mutations within the BCL-6 5′-noncoding sequences of 37 single GC B cells. (Upper) Schematic representation of the BCL-6 gene. Coding and noncoding exons are indicated by filled and empty boxes, respectively. The PCR fragment amplified for mutational analysis is approximately positioned below the map and blown up in the lower panel to show the distribution of mutations. Each line represents a 20-bp interval of the BCL-6 sequence amplified, and the first nucleotide of the BCL-6 cDNA is designated as position +1. Mutations included single base pair substitutions (closed ovals) and deletions (brackets). For each cell, identified by its code number, the type and exact position of the mutation are specified on the right column (Δ, deletion). Note that all of the 68 nucleotide exchanges, including deletions, were found in heterozygosis when both alleles were amplified (cells marked by an asterisk).

