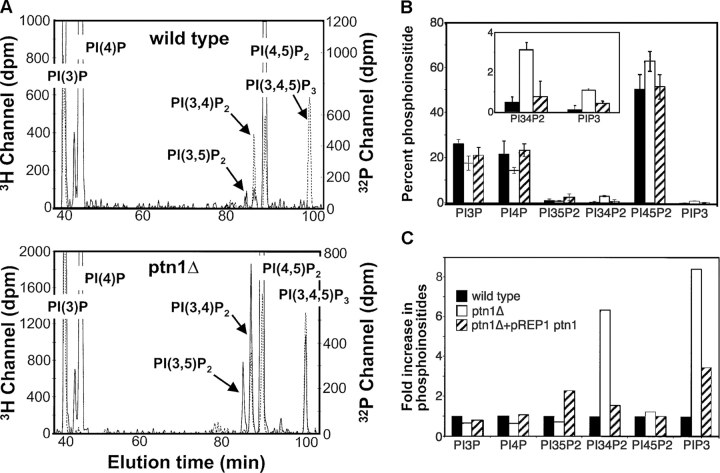
Figure 2.
Ptn1p affects PI levels in cells. (A) HPLC profiles of [3H]inositol-labeled phosphoinositides from wild-type and ptn1Δ cells (solid lines). 32P-labeled lipids were used as internal standards (dashed lines). (B) Quantification of phosphoinositide levels in wild-type cells, ptn1Δ cells, and ptn1Δ cells transformed with pREP1 ptn1p expression vector (ptn1Δ+pREP1 ptn1p). The data were normalized to give the sum of PI phosphates a value of 100%. We used this method because the incorporation of [3H]inositol into PI relative to PI phosphates varied considerably from sample to sample (11.0 ± 6.7, average ± SD). The inset shows a magnified view of the values for PI(3,4)P2 and PI(3,4,5)P3. (C) Fold increase in phosphoinositide levels as compared with the levels in wild-type cells. The data were normalized to give each wild-type phosphoinositide a value of 1.

