
Figure 3.
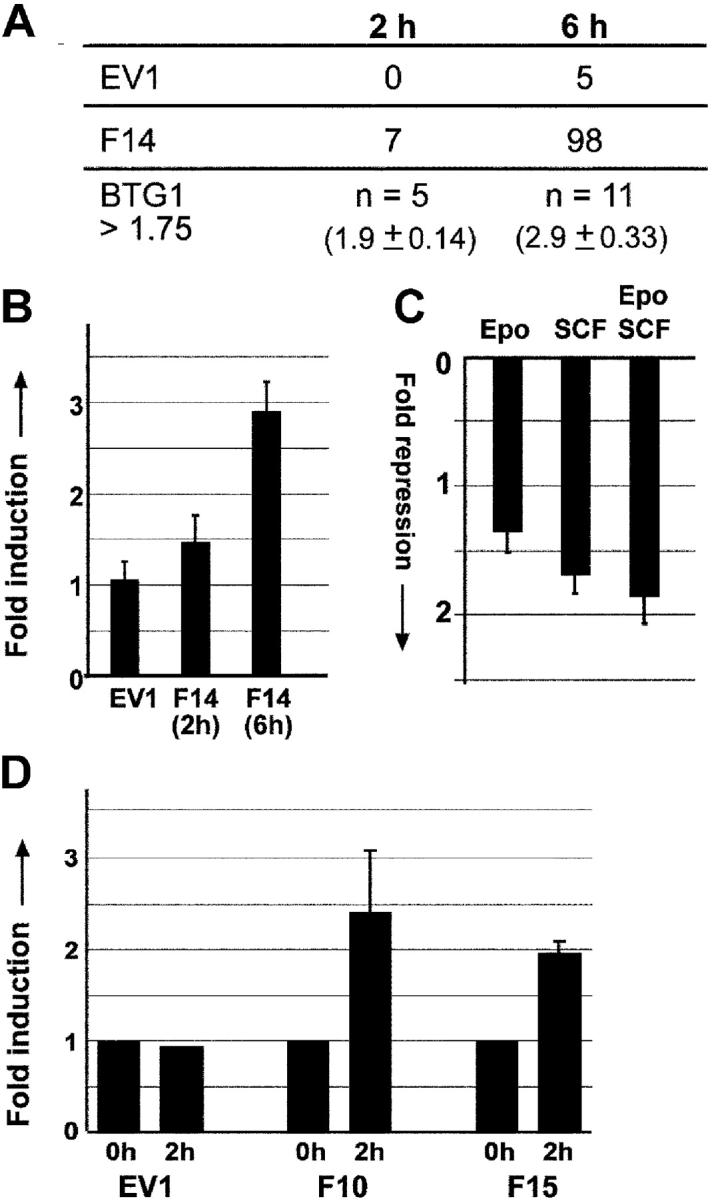
BTG1, a FoxO3a target gene. Labeled cDNA from FoxO3a(A3):ER clone F14 and vector clone EV1, exposed to 50 nM 4OHT for 0, 2, and 6 h in the presence of Epo, SCF, and Dex, were hybridized to a 9,000 cDNA microarray enriched for hematopoietic transcripts. (A) The number of spots that detected a >1.75-fold increase in signal upon treatment with 4OHT compared with nontreated cells is indicated for both clones after 2 and 6 h of treatment. BTG1 was represented at least 11 times on these arrays, 5 of these BTG1 spots showed >1.75-fold up-regulation after 2-h induction with 4OHT. (B and C) The average regulation on the 11 BTG1 spots is calculated after 2 and 6 h of 4OHT treatment (B) and after 2 h of Epo, SCF, or Epo plus SCF induction of factor-deprived cells (C), 1 meaning no regulation. Error bars indicate SD. (D) Control clone EV1 and FoxO3a(A3):ER clones F10 and F15 were treated with 50 nM 4OHT for 2 h, and relative BTG1 expression was determined by real-time PCR, using expression of RNase inhibitor to normalize the values. Values represent mean ± SD of three independent experiments.