
Figure 8.
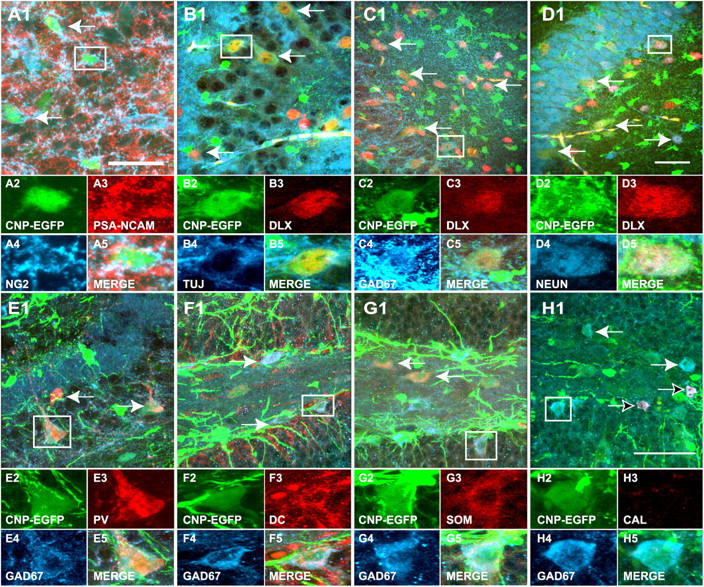
Endogenous EGFP + cells in the postnatal hippocampus display a GABAergic interneuron phenotype. P8 sagittal sections and CA3 and DG regions of the hippocampus. (A) A proportion of the NG2+/EGFP+ cells (blue/green, respectively) in the DG express PSA-NCAM (red). (B) A proportion of the EGFP+ cells coexpress Dlx (red) and class III β-tubulin (blue). (C) The majority of the EGFP+ cells (green) that express Dlx (red) also express GAD-67 (blue). (D) All the EGFP+/NeuN+ cells (green/blue, respectively) also express Dlx (red). (E and F) A proportion of the EGFP+ cells in CA3 (E) and DG (F) express parvalbumin (E, PV; red), doublecortin (F, DC; red), and GAD-67 (blue). (G) In the hilar region of the DG and in CA3 (not depicted), a significant proportion of the EGFP+ cells express the neuropeptide somatostatin (SOM, red) and GAD-67 (blue). (H) EGFP+ cells that are positive for GAD-67 (blue) are not labeled with antibodies against calretinin (CAL, red). White arrows in A1–H1 indicate EGFP+ cells that are also labeled for all the markers analyzed. In H1, black arrows indicate EGFP-negative CAL+/GAD-67+ cells. Cells in boxed areas are shown at higher magnification. Quantitative analysis of these data is shown in Table II. Bars, 50 μm.