Figure 7.

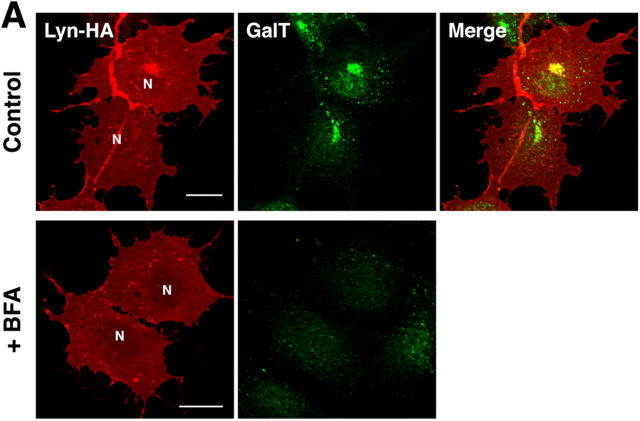
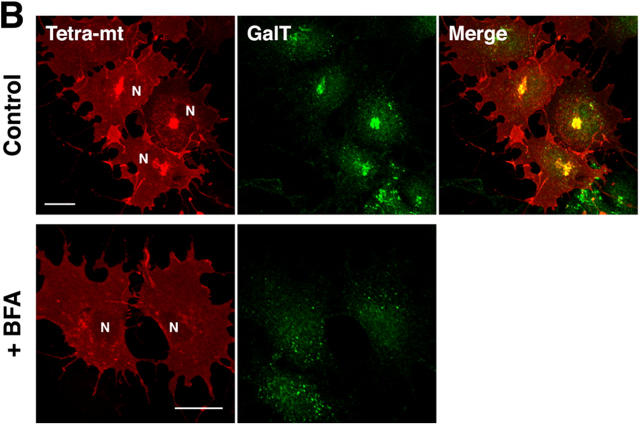
Involvement of the four charged residues in transport of Lyn from the Golgi to the plasma membrane. COS-1 cells transfected with Lyn-HA (A) or Tetra-mt (B) were cultured for 1 d in the absence or presence of 5 μg/ml BFA during the last 1 h. Cells were double stained with anti-Lyn (red) and anti-GalT (green). (C and D) Lyn trafficking was visualized in living COS-1 cells transfected with Lyn-GFP (C) or Tetra-mt-GFP (D). (a) Whole area of a cell was bleached, and the cell was monitored for the next 90–110 min at 2-min intervals. Times are shown from completion after the photobleaching. (b) Quantification of fluorescence recovery in the perinuclear region (circled area) and the plasma membrane (boxed area). Mean fluorescence intensities of recovery after photobleaching are plotted versus time. N, nucleus. Bars, 20 μm.


