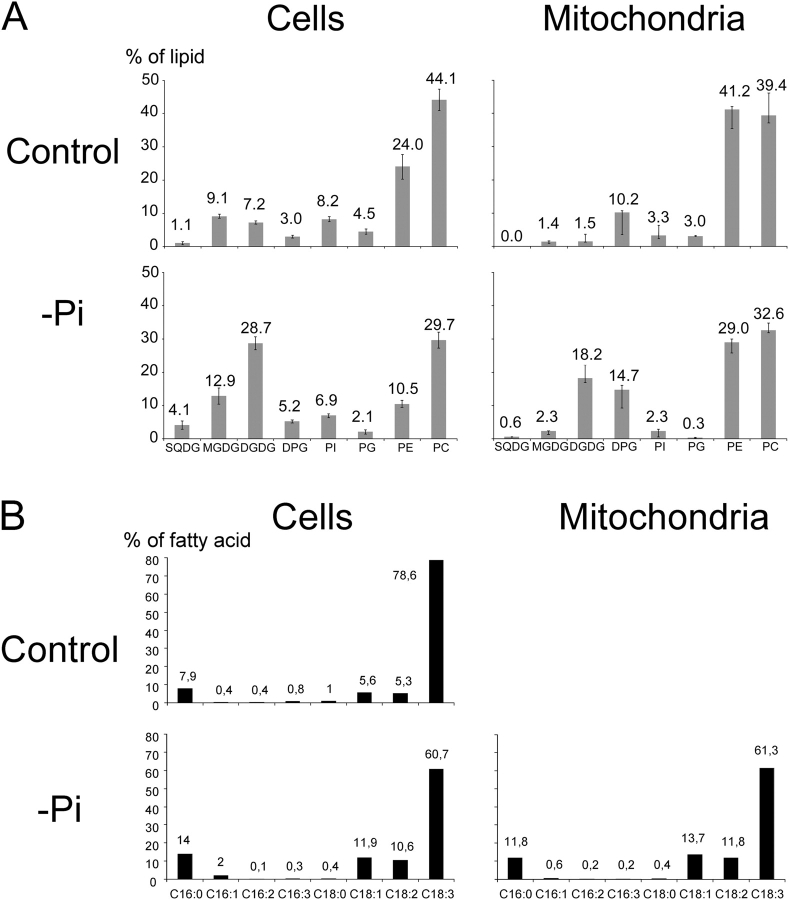
Figure 3.
Glycerolipid analysis of total cell and mitochondria fractions from control and 3 d P i -deprived A. thaliana cells. (A) Glycerolipid composition. SD was calculated on four independent measurements in each case. (B) Fatty acid composition of DGDG isolated either from total cell extracts from 3 d Pi-deprived cells and control cells or from mitochondria fraction from 3 d Pi-deprived cells.

