
Figure 1.
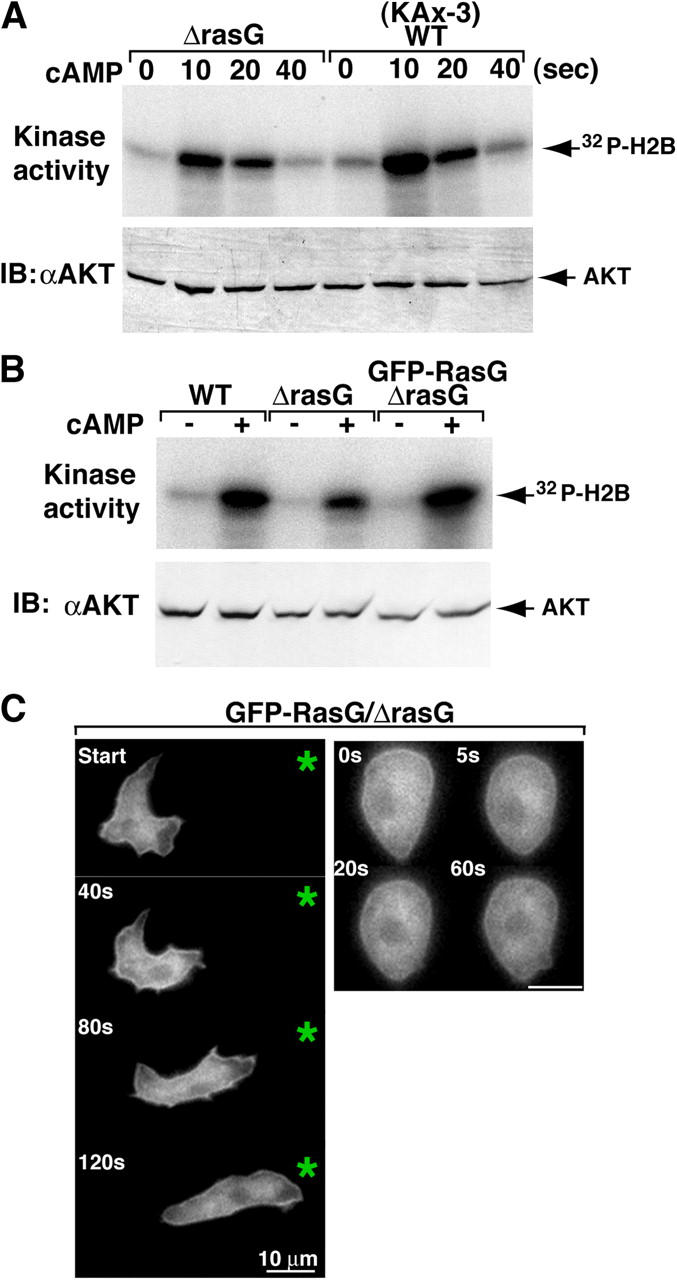
Ras regulates PI3K signaling and distribution along the membrane. (A and B) Activation of Akt/PKB is shown. Aggregation-stage cells (see Materials and methods) were treated with 10 μM cAMP for the indicated time (A) or at 10 s (B) and then lysed, Akt was immunoprecipitated with anti-Akt antibody, and Akt activity was assayed (Meili et al., 1999). Akt protein levels were determined in each sample by Western blot analysis (bottom panels). (C) Fluorescent images of GFP-RasG/rasG null cells exposed to a chemoattractant gradient (left) or to uniform chemoattractant stimulation (right). An asterisk indicates the position of the micropipette. The numbers in the top left corners represent the time after initiation when the image was captured. The data are representative of eight separate experiments.