Figure 5.
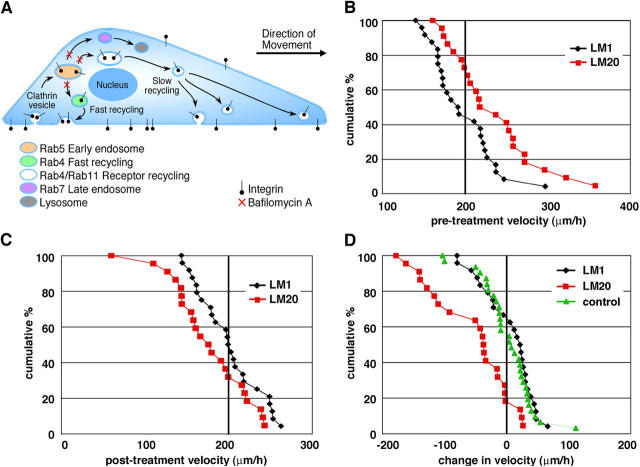
Inhibiting receptor trafficking slows cranial NCC motility on high concentrations of laminin. (A) Internalized cell surface receptors are endocytosed via clathrin-dependent mechanisms to the early endosome. Cargo is then transported either to the late endosome, to the receptor recycling compartments, or rapidly recycled back to the cell surface through a fast recycling pathway. Distinct areas of the pathway are characterized by specific Rab GTPases. The vacuolar proton pump inhibitor bafilomycin A prevents acidification of endocytic structures, thereby impairing transport out of the early endosome. (B) Cumulative distribution plots of cell velocity before drug treatment are shown where each point represents the pre-treatment velocity of a single cell. Cumulative percent on the y-axis refers to the percentage of the population traveling that speed or faster. The average velocity of cranial NCCs before treatment is 232 μm/h ± 11 (SEM; n = 22) on LM20 (red squares), compared with 196 μm/h ± 8 (n = 24) on LM1 (black diamonds). The difference between the two conditions is statistically significant (P < 0.01; t test). (C) Cumulative distribution plots of cell velocity after drug treatment are shown where each point represents the post-treatment velocity of a single cell. Cumulative percent on the y-axis refers to the percentage of the population traveling that speed or faster. The average velocity of cranial NCCs post-treatment is 174 μm/h ± 10 (SEM; n = 22) on LM20 (red squares), compared with 199 μm/h ± 8 (n = 24) on LM1 (black diamonds). The difference between the two conditions is statistically significant (P < 0.05; t test). (D) Cumulative distribution plots of the change in cell velocity after BafA (100 nM) treatment. Each point represents the change in velocity of a single cell after BafA treatment. Cells cultured on LM20 (red squares) and treated with BafA slowed an average of 58 μm/h ± 14 (n = 22) (post-treatment velocities were statistically different from pre-treatment velocities; P < 0.001; paired t test). In contrast, cells cultured on LM1 and treated with BafA (black diamonds; n = 24), and controls, cells cultured on either laminin concentration and treated with vehicle (green triangles; n = 31), did not slow significantly (pre- and post-treatment velocities were not statistically different; P > 0.05, paired t test). Post-treatment velocities of control cells were significantly different from post-treatment velocities of BafA-treated cells on high laminin (P < 0.05; t test). Specific points in each graph are not directly comparable to corresponding points in other graphs, as each point merely reflects a cell's velocity, or change in velocity, in relation to the whole population.

