
Figure 2.
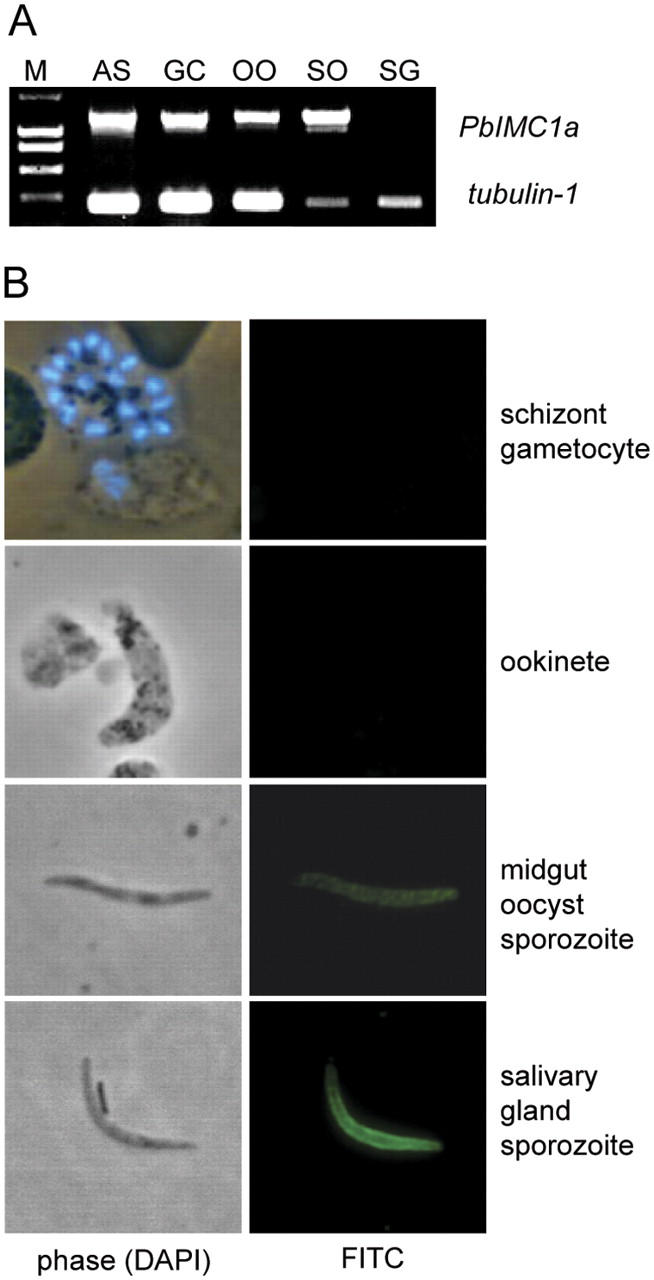
Transcription and expression of PbIMC1a. (A) RT-PCR analysis of PbIMC1a and tubulin-1 mRNA in samples of asexual blood stages (AS), gametocytes (GC), ookinetes (OO), midguts with sporulating oocysts (SO), and sporozoite-infected salivary glands (SG). M: molecular weight markers. (B) IFA staining (FITC) of different life stages with anti-PbIMC1a antiserum. Phase: phase contrast. Blood stages are double-stained with DAPI (blue) to show merozoite and gametocyte nuclei.