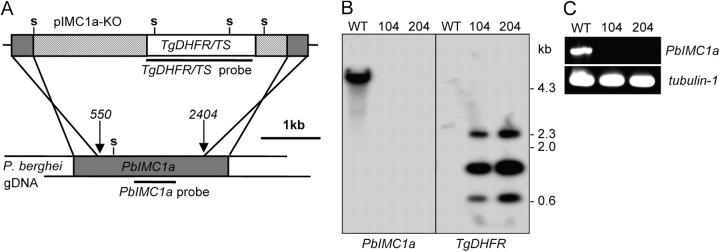
Figure 3.
Targeted disruption of PbIMC1a. (A) Diagram of the recombination strategy. Indicated are sequences specific for PbIMC1a (dark gray); PbDHFR (light gray); TgDHFR/TS (white); positions of SphI restriction sites (s); and probes used in Southern blot. (B) Southern analysis of SphI-digested genomic DNA (gDNA) from WT and PbIMC1a-KO parasite clones 104 and 204. (C) RT-PCR analysis of blood stages total RNA for mRNA of PbIMC1a and the reference gene tubulin-1.

