Figure 5.
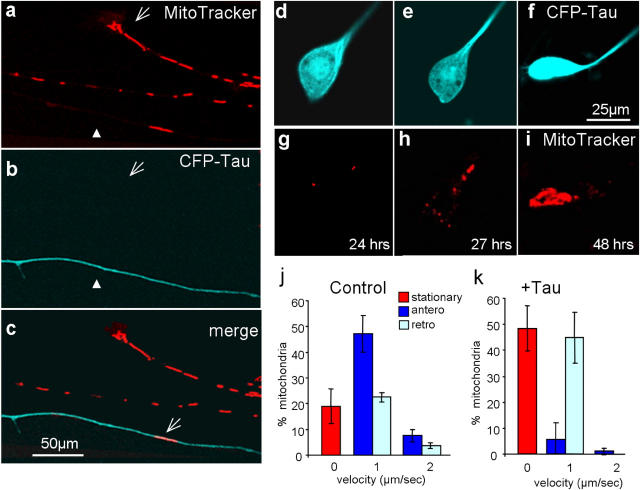
Distributions of mitochondria in RGC axons, 48 h after transfection with Tau by adenovirus. (a–c) Field of axons stained with MitoTracker (a), CFP-Tau (b), and merge (c). Mitochondria are frequent in normal axons, but have almost disappeared from tau-transfected axons (see bottom axon in b and c, blue, closed arrowheads). (d–f) Expression of tau with time after transfection, and (g–i) corresponding clustering of mitochondria in cell body. Tau gradually moves out into the axon, whereas mitochondria accumulate in the cell body. (j and k) Quantification of mitochondria movements in controls (j) and tau-transfected cells (k). In control cells, anterograde movements dominate (55%, dark blue bar), in tau-transfected cells anterograde transport decreases (to 7%), immobile particles increase (to 50%, red bar), and retrogradely moving particles increase (to 45%, light blue bar). Error bars indicate SEM.

