Figure 2.
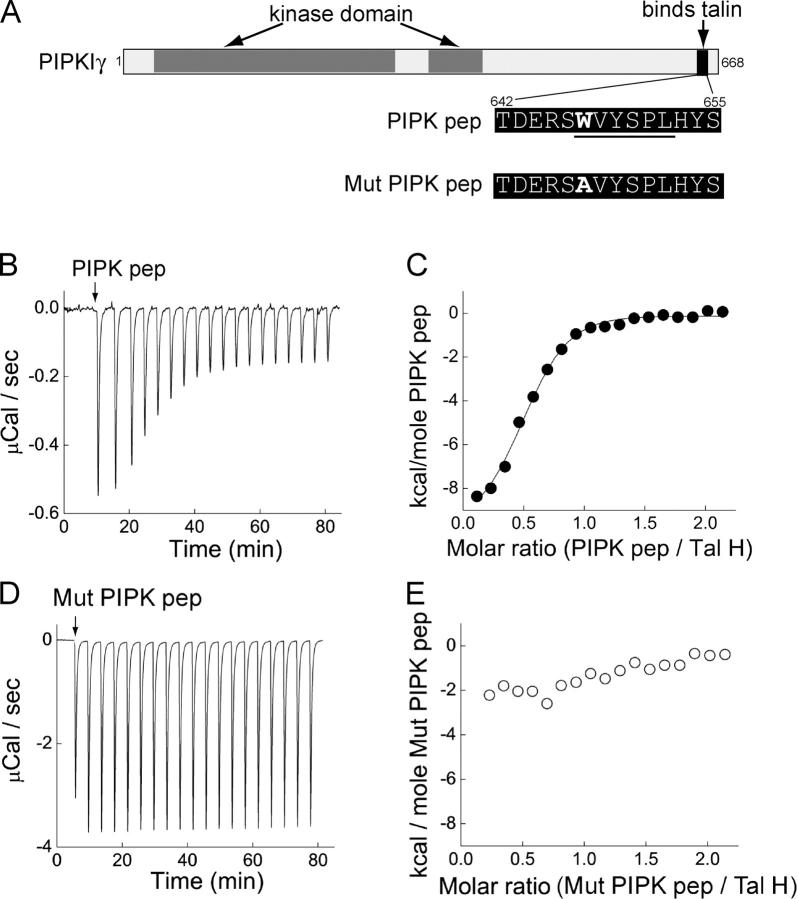
Binding of a PIPK peptide to talin head. (A) Diagram showing the domain structure of human PIPKIγ and the sequences of the PIPK peptides. Underlined residues indicate the talin binding region. (B–E) ITC traces showing the responses when either PIPK pep (B) or Mutant PIPK pep (D) was injected (arrow) into a chamber containing talin head (Tal H). Decreased magnitude of the response indicates talin saturation by PIPK pep. Dose–response curves show that PIPK pep (C), but not Mutant PIPK pep (E), binds to talin head. Data points were derived from B and D and were fit with a nonlinear least squares function (solid line).

