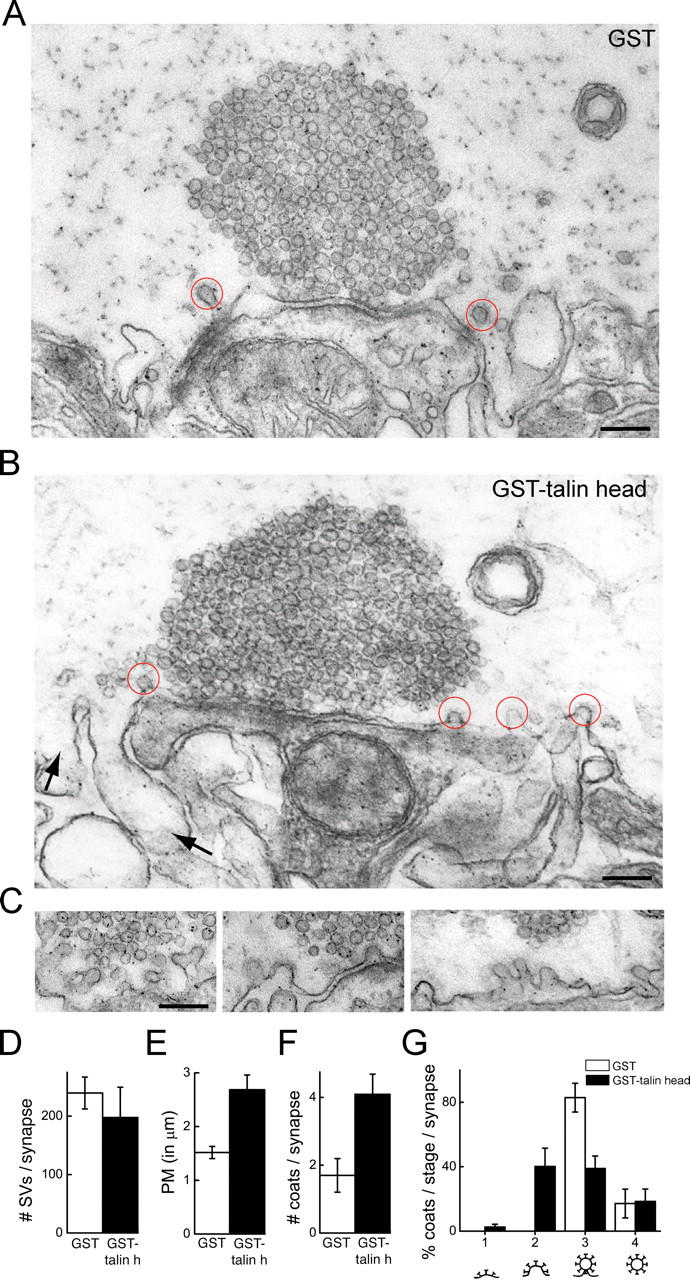
Figure 5.

Ultrastructural changes produced by talin head at lamprey synapses. (A and B) Electron micrographs of stimulated synapses after axonal injection of either GST or GST-talin head. In the presence of GST (A), only few coated pits are observed. In contrast, more clathrin-coated pits (red circles) and large membrane foldings (arrows) are observed in the presence of GST-talin head (B). (C) Gallery showing unconstricted clathrin-coated pits in periactive zones within GST-talin head–injected axons. Bars, 0.2 μm. (D–G) Quantification of the number of SVs (D), the PM cross-sectional profile (E), the total number of clathrin-coated profiles (F), and percentages of coated profiles at various stages of maturation (G) per synapse cross section. Data represent mean values and SEM of 10 synapses from 4 axons injected with GST controls and 11 synapses from 4 axons injected with GST-talin head.
