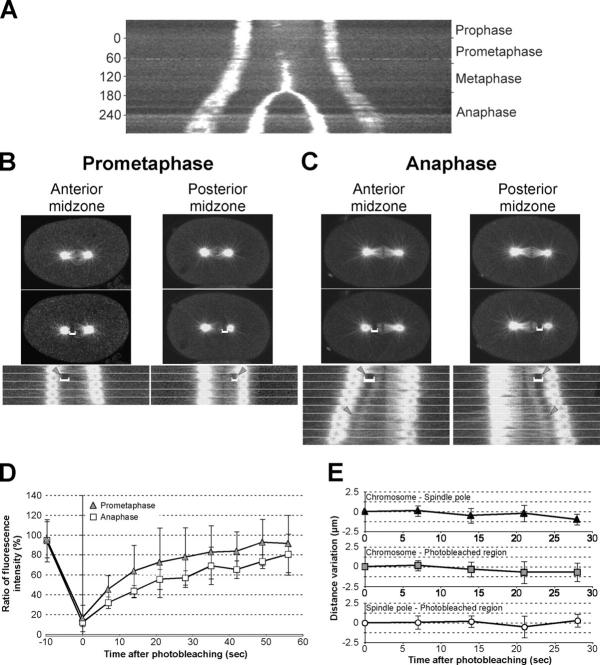
Figure 5.
Chromosome segregation occurs without anaphase A and significant poleward flux. (A) Spindle-centered kymograph of an embryo expressing both γ-tubulin and histone H2B fused to GFP. This kymograph was produced similarly to the one in Fig. 1 B, except that posterior movement of the spindle was eliminated: the spindle in each frame of time-lapse images was rotationally aligned and recentered on the midpoint between the centrosomes to allow the observation of symmetries in the spindle. Frames were acquired at 7-s intervals. (B and C) Time-lapse images of embryos expressing β-tubulin::GFP in which a short region of anterior (left) or posterior (right) spindle microtubules were photobleached during prometaphase (B) or anaphase (C) onset. The bottom panels follow FRAP as well as movement of the photobleached region (indicated by gray arrowheads). Frames were acquired at 7-s intervals. For photobleaches of the spindle during prometaphase, kymographs were aligned to the location of chromosomes in the center of the spindle. For photobleaches of the anterior or posterior half of the spindle at anaphase onset, kymographs were aligned to the center of the posterior or anterior centrosome, respectively. (D) Quantification of FRAP during prometaphase (gray triangles) and anaphase (open squares). To correct for fluorophore bleaching and embryo to embryo variations, fluorescence intensity in the photobleached region is expressed as a ratio of bleached over unbleached midzone microtubules in the same embryo. FRAP occurs faster during prometaphase (t 1/2 = 10.6 s; polynomial equation: y = −3E − 07 x4 + 4E − 05x3 − 0.0021x2 + 0.0559x + 0.1571; R2 = 0.997) compared with anaphase (t 1/2 = 17.7 s; polynomial equation: y = 4E − 08x4 + 2E − 06x3 − 0.0005x2 + 0.0303x + 0.1223; R2 = 0.989). Time points were acquired at 7-s intervals. Error bars represent SD over six embryos. (E) Quantification of the distance variation between chromosomes to photobleached region (black triangles), chromosomes and spindle poles (gray squares), and spindle pole to photobleached region (open circles) during anaphase. The distance remains constant between these three positions throughout anaphase. Time points were acquired at 7-s intervals. Error bars represent SD over six embryos.

