
Figure 1.
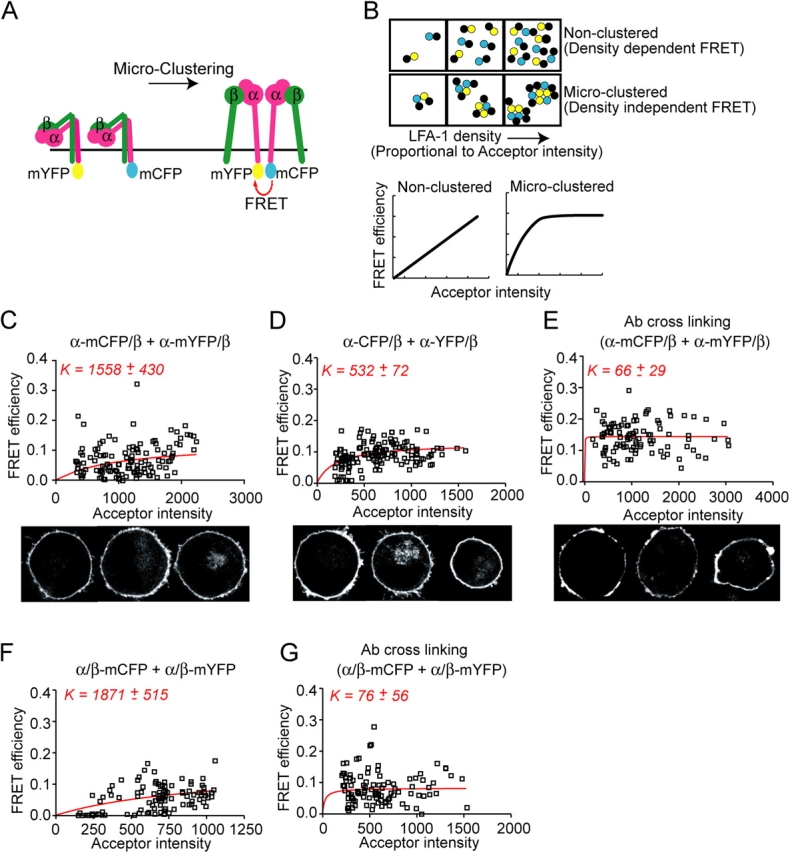
Experimental design and validation of inter-heterodimer FRET microclustering assay. (A) A hypothetical model (Li et al., 2003) for integrin clustering. Cells expressing heterodimers with either the α (shown) or β subunits tagged with both mCFP and mYFP will exhibit FRET only when heterodimers are brought into close proximity (< 100 Å). (B) Schematic (top) and model curves (bottom) for FRET behavior under nonclustered and microclustered conditions (Kenworthy et al., 2000; Zacharias et al., 2002). See Results. (C–G) Inter-heterodimer FRET and acceptor intensities for individual ROIs from K562 cells expressing αL-mCFP/β2 and αL-mYFP/β2 (C and E), αL-CFP/β2 and αL-YFP/β2 (D), or αL/β2-mCFP and αL/β2-mYFP (F and G) were fit to  (red curves) using the Lineweaver-Burke equation as described in Materials and methods. Where indicated, cell surface LFA-1 was cross-linked by preincubation with either 10 μg/ml of TS2/4 mAb to αL (E) or CBR LFA-1/7 mAb to β2 (G) and secondary, purified goat anti–mouse antibody (10 μg/ml) for 30 min at 37°C. Representative confocal images, depicting the YFP signal from selected experiments (C–E), are shown below the graphs.