
Figure 8.
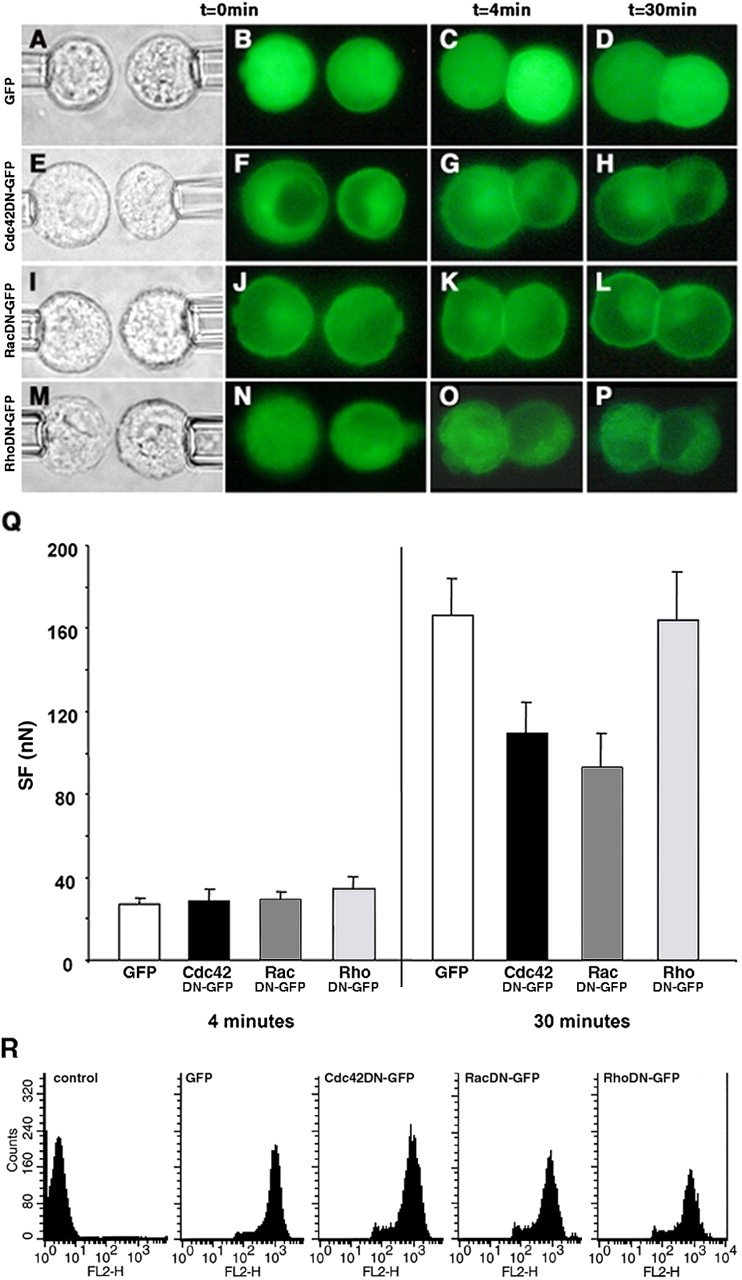
The effect of dominant negative GTPase protein expression on SF. Distribution of GFP-tagged proteins in transfected Ecad cells producing GFP (B–D), and the Cdc42DN (F–H), RacDN (J–L), and RhoDN (N–P) before contact (B, F, J, and N), in 4-min doublets (C, G, K, and O) and in 30-min doublets (D, H, L, and P). Each row represents a series of real-time images of a doublet monitored by light transmission or epifluorescence microscopy before and at 4 and 30 min of contact. Q, SF measured for 4- and 30-min Ecad doublets producing either GFP (white bars), Cdc42DN (black bars), RacDN (dark gray bars), or RhoDN (light gray bars). (R) FACS analysis of transiently transfected Ecad cells, positive for GFP, Cdc42DN, RacDN, or RhoDN, and immunostained with an antibody directed against the extracellular domain of E-cadherin (FL2 channel).