
Figure 9.
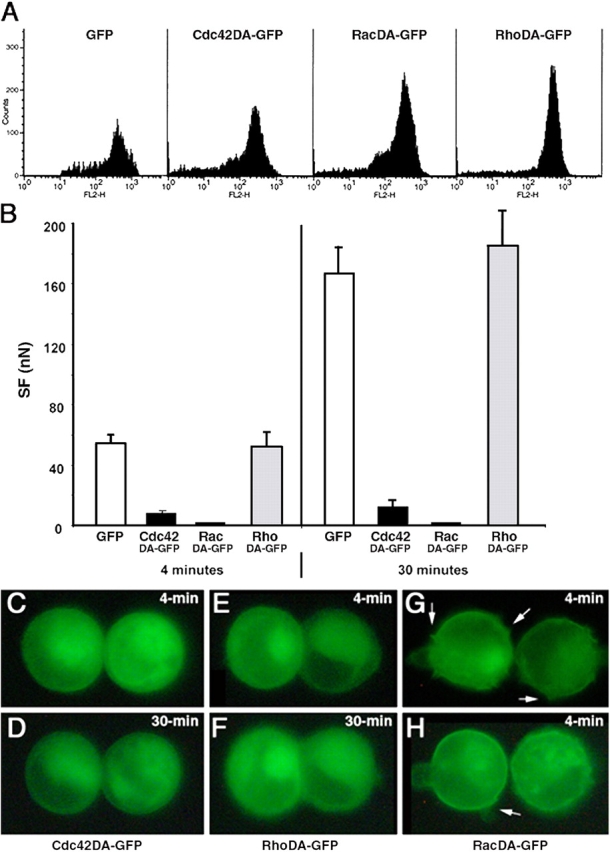
The effect of dominant active GTPase protein expression on SF. (A) FACS analysis of transiently transfected Ecad cells, positive for GFP, Cdc42DA, RacDA or RhoDA, and immunostained with an antibody directed against the extracellular domain of E-cadherin (FL2 channel). (B) SF measured for 4- and 30-min Ecad doublets producing GFP (white bars), Cdc42DA (black bars), RacDA (dark gray bars) and RhoDA (light gray bars). Real-time images showing the distribution of GFP-tagged proteins in 4-min (C, E, G, and H) and 30-min (D and F) doublets of Ecad cells producing Cdc42DA (C and D), RhoDA (E and F), or RacDA (G and H). Arrows in G and H indicate the membrane protrusions specifically observed in RacDA transfectants.