
Figure 3.
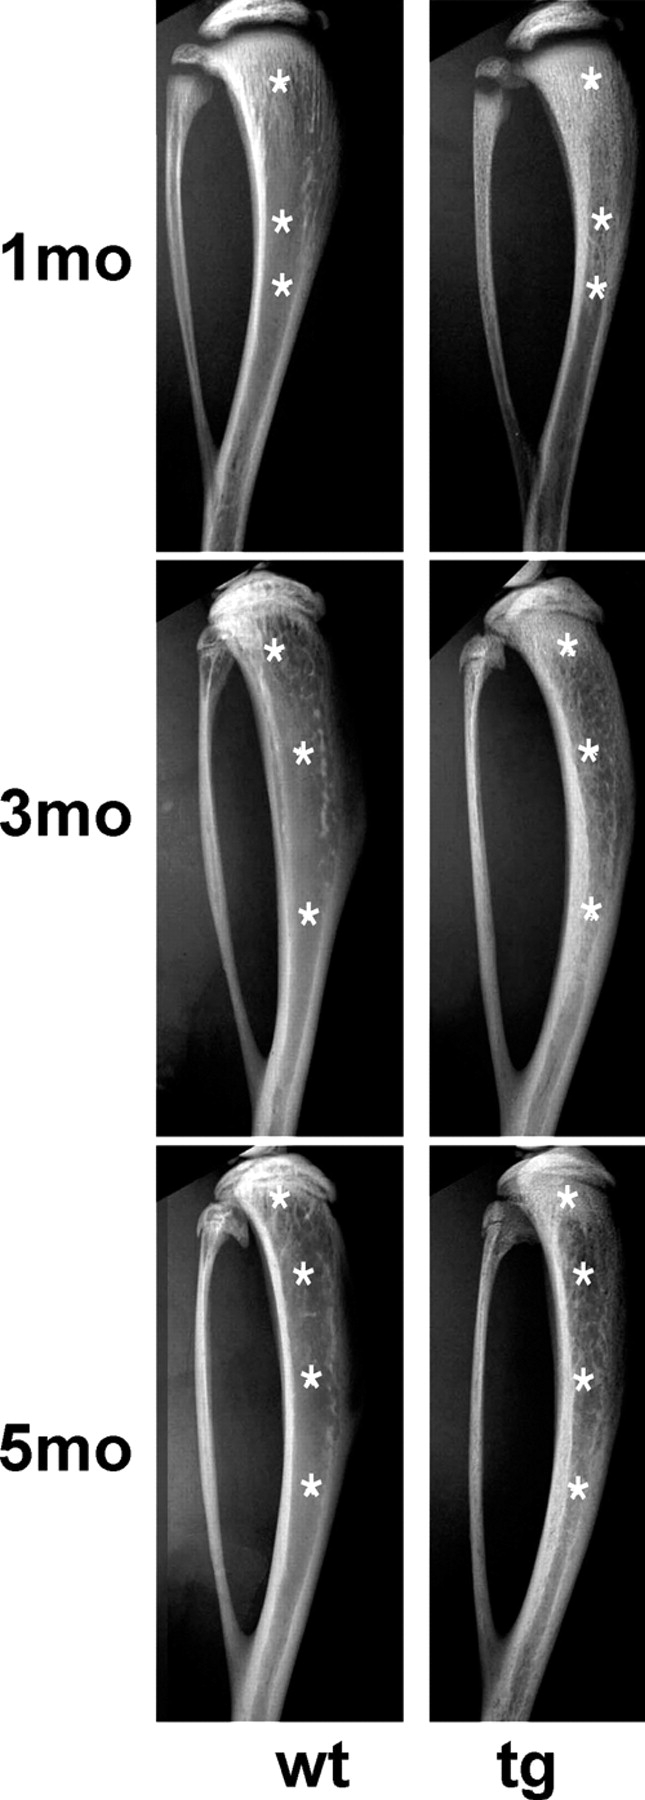
Relative growth of marrow cavities with respect to bone over time. High resolution radiograms of tibia and fibula at 1, 3, and 5 mo. At 1 mo, a much longer primary spongiosa is observed in tg mice than in wt mice. In continuity with the extended primary spongiosa, abundant trabeculae are detected in the medullary cavity of the diaphysis. Corresponding regions in wt tibia show a bone-free marrow cavity. At 3 mo, a dense primary spongiosa is still present in the tg tibia, albeit much reduced in length compared with what is observed at 1 mo. Below this region, a marrow cavity is discernible. However, it is occupied by a dense meshwork of bone trabeculae. Corresponding regions in the wt tibia show a bone-free marrow cavity. A similar pattern is observed at 5 mo. Asterisks mark corresponding regions in the primary spongiosa, metaphysis, and diaphysis in radiograms of wt and tg mice.