
Figure 5.
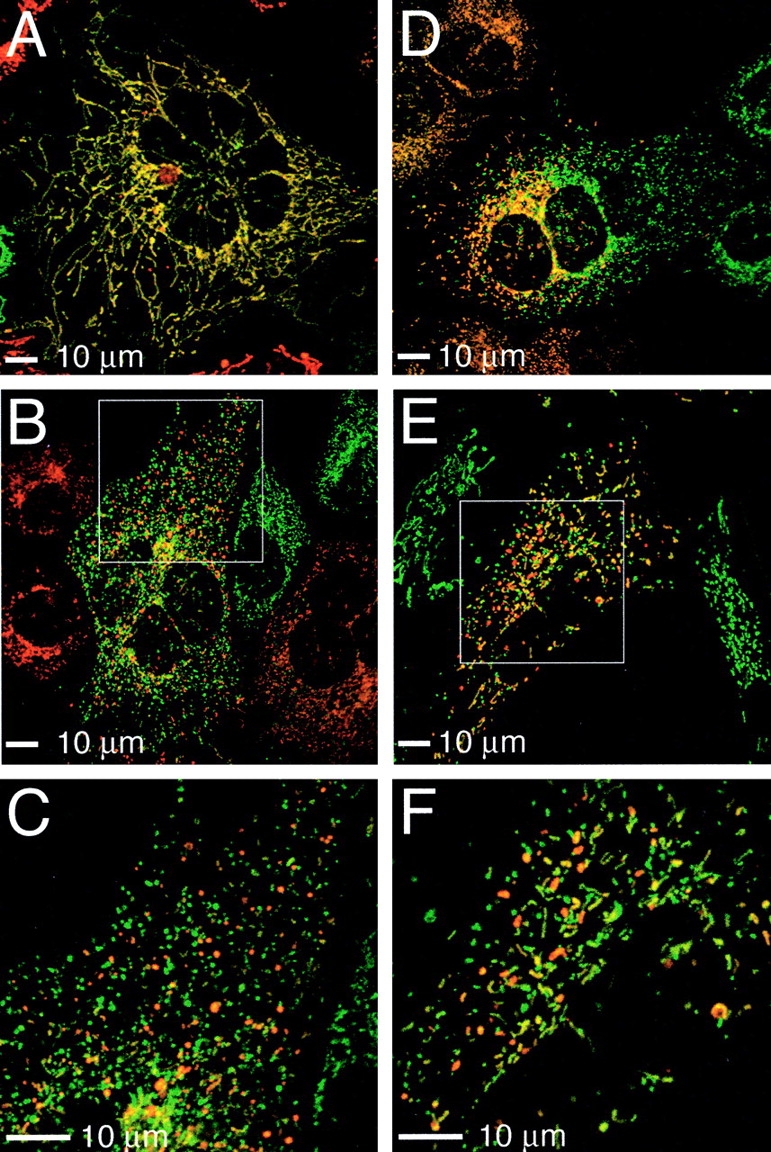
Mitochondrial fusion assay. PEG fusion of cells containing mitochondrially targeted dsRed and GFP. (A) Wild-type cell showing extensive mitochondrial fusion. (B and E) Mfn1 (B) and Mfn2 (E) mutant cells displaying predominantly unfused mitochondria. (C and F) Magnified views of boxed portions in B and E, respectively. (D) Sectoring effect in Mfn1 mutant cell.