
Figure 6.
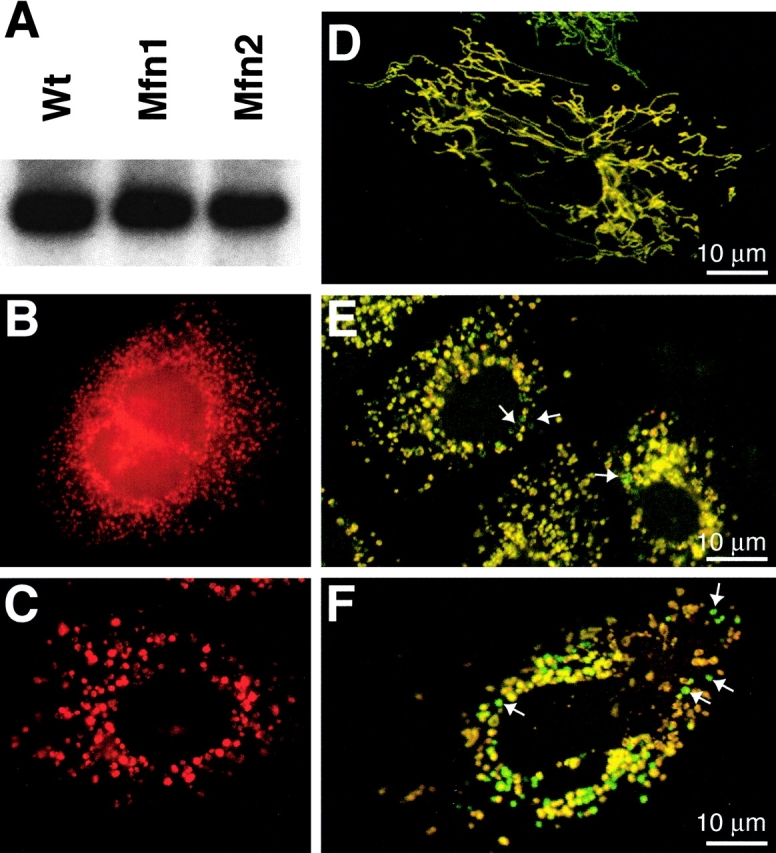
Stochastic loss of membrane potential in mitochondria of mutant cells. (A) mtDNA is detected by Southern blot analysis using a COX1 probe. (B and C) COXI expression in Mfn1 (B) and Mfn2 (C) mutant cells. (D–F) Staining of mitochondria using dyes sensitive to membrane potential. Wild-type (D), Mfn1 mutant (E), and Mfn2 mutant (F) cells expressing mitochondrially targeted EYFP (green) were stained with the dye MitoTracker Red, whose sequestration into mitochondria is sensitive to membrane potential. In these merged images, note that in the mutant cells (E and F) a subset of mitochondria (arrows) stain poorly with MitoTracker Red and thus appear green.