Figure 2.
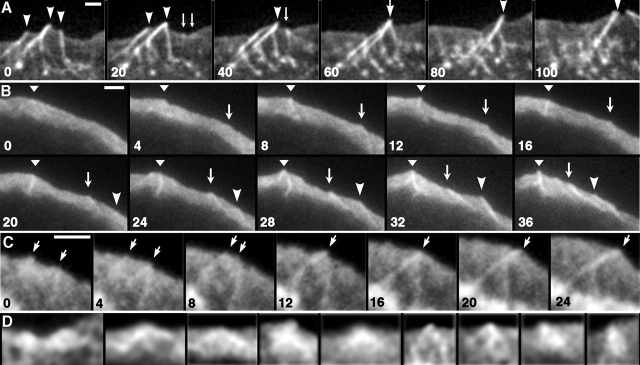
Actin kinetics during filopodia initiation. (A–C) Time-lapse sequences of GFP-actin–expressing B16F1 cells. Time in seconds; individual features marked by arrows and arrowheads. Nascent filopodia are marked starting from the frame preceding the appearance of the recognizable precursor. (A) Three established filopodia (0 s, arrowheads) fuse with each other (0–60 s). Two Λ-precursors (arrows) appear (20 s), and fuse with each other (40 s), forming a nascent filopodium that subsequently (60 s) joins the fusing older filopodia. (B) Several nascent filopodia form from Λ-precursors that appear within lamellipodium. (C) Two Λ-precursors existing at 0 s (arrows) fuse with each other (12 s), producing a nascent filopodium with a Λ-shaped root. The fusion point treadmills backward while the filopodium protrudes forward. (D) Gallery of Λ-precursors. First four examples represent enlarged and enhanced Λ-precursors from A (20 s), B (8 s), B (24 s), and C (0 s), respectively. Remaining examples are from other sequences. Bars, 2 μm.

