
Figure 5.
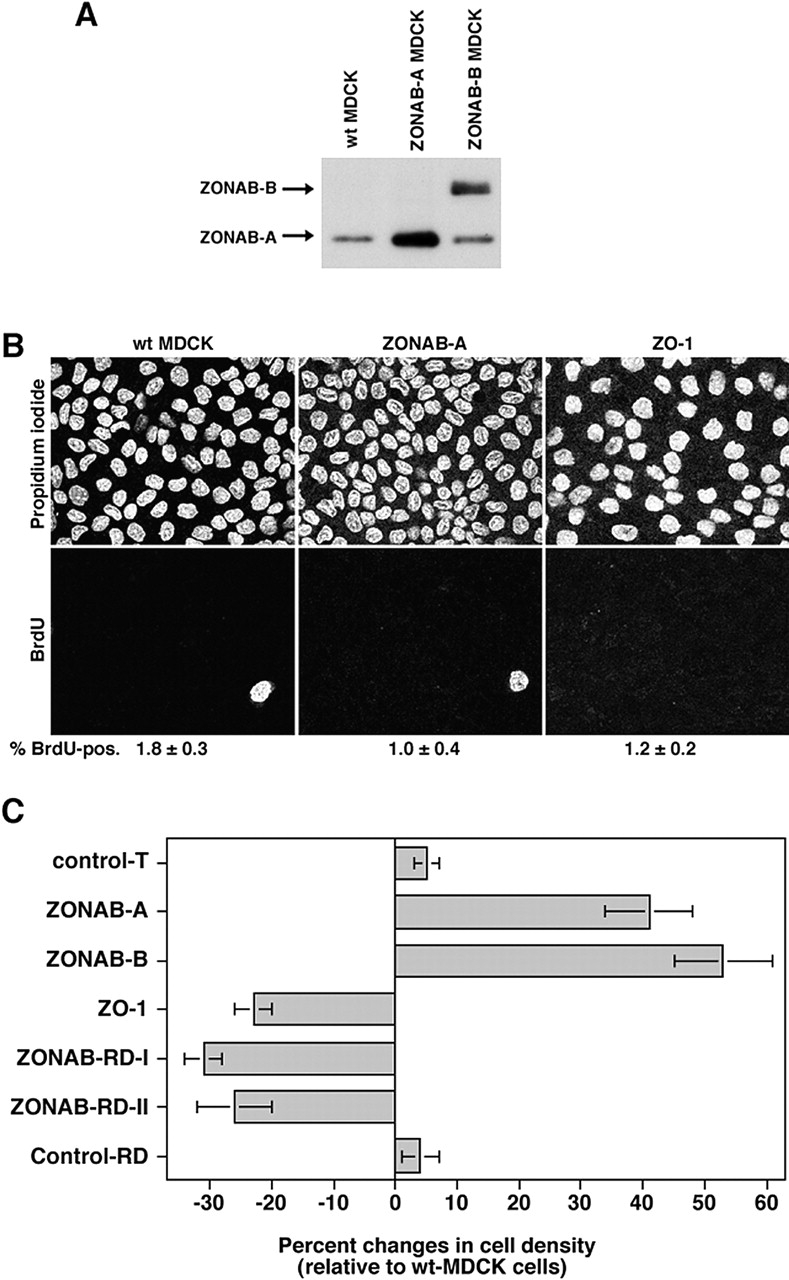
Regulation of final cell density by ZONAB. (A) Expression of ZONAB in high density wild-type and transfected MDCK cells. Wild-type (wt MDCK) and ZONAB-A or -B overexpressing cells were grown for 7 d. Cells cultured for 7 d had reached maximal cell density. Cultures were harvested, and equal amounts of protein were loaded on SDS-PAGE gels for analysis of ZONAB expression by immunoblotting. (B) Cell cycle arrest of high density MDCK cells. Wild-type or transfected MDCK cells overexpressing ZO-1 or ZONAB were grown to full density, and cell cycle arrest was determined by BrdU incorporation. Shown are representative images of propidium iodide and BrdU labelings, and the indicated numbers are the percentage of BrdU-positive cells (averages of two independent experiments are shown). Note the different cell densities in the propidium iodide staining. (C) Cell density of mature monolayers. Cells grown as those in B were harvested and counted. The cell number per cm2 of culture was calculated and expressed as percent changes relative to wild-type MDCK cells. The value shown for control transfections (control T) represents cell densities obtained from cell lines expressing three different control cDNAs generated with the same expression vector. Shown are averages ± 1 SD of independent clones that were analyzed twice independently using triplicate cultures. Analyzed were three different clones expressing ZONAB-A, three ZONAB-RD-I clones, and two independent clones each for ZONAB-B, ZO-1, ZONAB-RD-II, and Control-RD. All cell lines with the exception of the two types of control transfection were significantly different from wild-type cells (t test; P < 0.05).