
Figure 6.
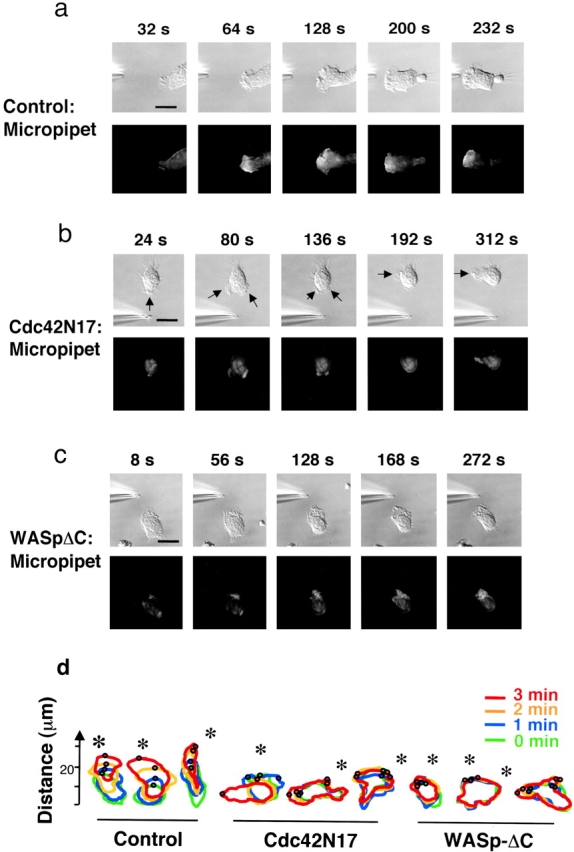
Inhibition of Cdc42 activity blocks migration toward a point source of chemoattractant. (a–c) Migration of cells toward a point source of fMLP (10 μM fMLP in a micropipette). Cells expressed PH-Akt-GFP alone (a) or in combination with Cdc42N17 (b) or WASpΔC (c). The top images show the morphology of a single cell by Nomarski microscopy at the indicated times after chemoattractant stimulation; the bottom images show spatial localization of PH-Akt-GFP in the same cell at the same time points. Arrows identify leading edges. Bars, 10 μm. The experiments in a and b are shown in videos 3 and 4, respectively, available at http://www.jcb.org/cgi/content/full/jcb.200208179/DC1. (d) Outlines of migrating cells observed after exposure to an fMLP-containing micropipette (locations indicated by asterisks). As in Fig. 5 c, each set of outlines represents a cell observed at 1-min intervals (denoted by colors as indicated), from 0 to 3 min after exposure to the micropipette. Small circles in each outline represent the center of a PH-Akt-GFP–containing lamella at the cell periphery.