
Figure 3.
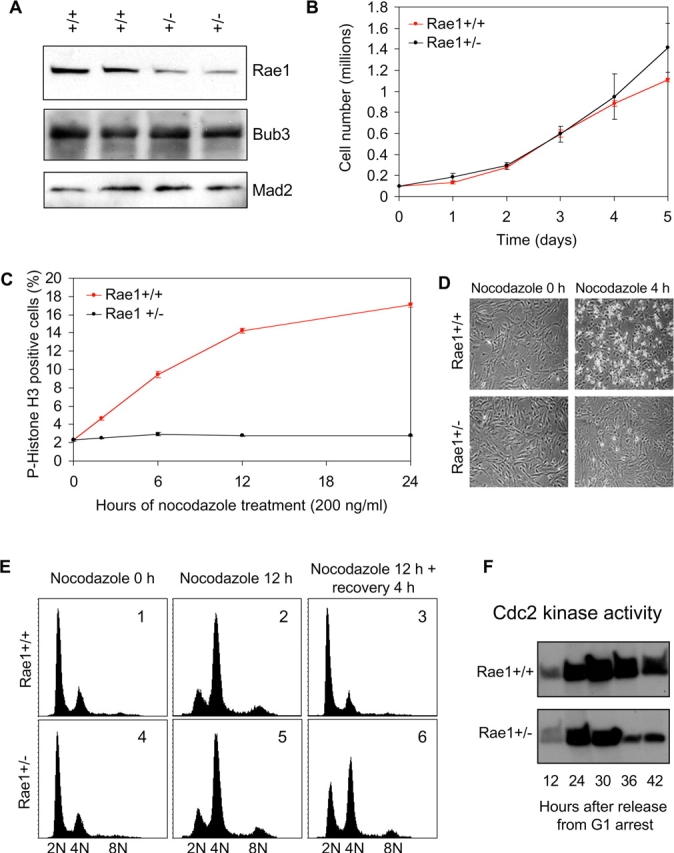
The mitotic checkpoint requires a full complement of Rae1. (A) Analysis of Rae1+/+ and Rae1+/− MEF lines for Rae1, Bub3, and Mad2 protein levels by Western blotting (4–20% polyacrylamide gel). 100 μg of total protein extract from each MEF cell line was used in the analysis. For probes, we used a rabbit antibody against mouse Rae1(188–368), a rabbit antibody against mouse Bub3(145–276), and a mouse monoclonal antibody against human Mad2 that recognizes mouse Mad2 (BD Biosciences). (B) Growth curves of primary MEFs. Data shown are means and standard deviations derived from three Rae1+/+ and three Rae1+/− MEF lines. (C) Mitotic index of nocodazole-treated Rae1+/− and Rae1+/+ MEF cell lines (n = 3 for each genotype). (D) Representative phase contrast images of Rae1+/+ and Rae1+/− MEF cultures before and after 4 h of nocodazole exposure. (E) Representative FACS® profiles of propidium-stained unsynchronized Rae1+/+ (panels 1–3) and Rae1+/− MEFs (panels 4–6). Durations of nocodazole treatment (80 ng/ml) and recovery intervals are indicated. (F) Cyclin B–associated Cdc2 kinase activity of synchronized MEF cells at indicated time points after release into nocodazole.