
Figure 3.
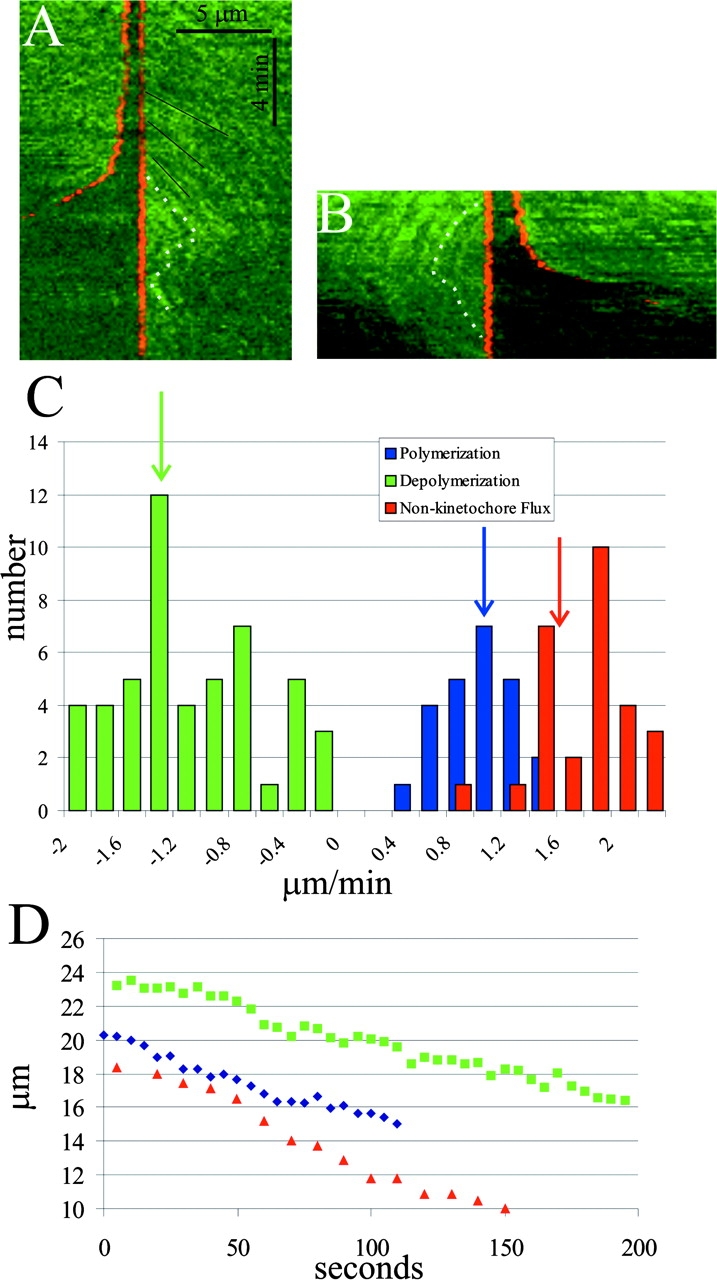
Confocal FSM of microtubule polymerization/ depolymerization at anaphase kinetochores. Time-lapse images were aligned so that a selected kinetochore was fixed in position relative to the rest of the spindle (see text). A and B are kymographs made from two different aligned spindles. Dotted white lines in each kymograph highlight speckle movements relative to the aligned kinetochores. In both examples, polymerization at the kinetochores slows as sisters begin to separate in anaphase (e.g., slopes of black lines in A become more vertical). When polymerization is slow enough, the kinetochore switches to depolymerization, where speckles are seen to move toward and disappear at the kinetochores. The kinetochore in A persists in depolymerization, whereas the kinetochore in B switches back to polymerization during the interval analyzed. (C) Histograms of velocities measured for polymerization and depolymerization at kinetochores and flux during anaphase. Arrows mark the average values. Depolymerization = 1.2 ± 0.6 μm/min (n = 27); polymerization = 0.9 ± 0.3 μm/min (n = 24 measurements); flux = 1.6 ± 0.4 μm/min (n = 27). We were unable to obtain values as chromosomes approached their poles because of the curvature of the kinetochore fibers. (D) Poleward movements of three kinetochores during the first two thirds of anaphase A. Notice that the kinetochores exhibit asynchronous periods of fast and slow movement. The average velocity over this period was 2.4 μm/min (n = 20 kinetochores from six spindles).