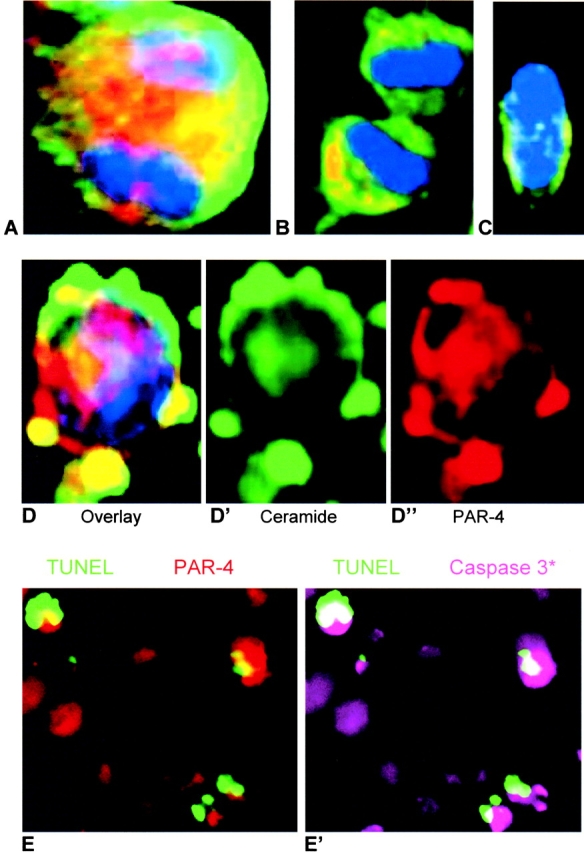
Figure 8.

Distribution of ceramide and PAR-4 during cell division of ES-J1 ES cells at the NP2 stage of differentiation and caspase 3 activation. Multiple, indirect immunofluorescence staining of differentiating ES-J1 cells 48 h after replating of EB8 cells (NP2 stage). Ceramide, FITC (green); PAR-4, (Alexa® 546, red); Hoechst (blue). A, mitotic cell in anaphase; B, mitotic cell in telophase; C, nonapoptotic cell; D–D′′, apoptotic cell. Leftmost picture (D) shows overlay of ceramide (D′), PAR-4 (D′′), and Hoechst staining; E, overlays of TUNEL (green) and PAR-4 (red) staining or E′, TUNEL (green) and activated caspase 3 (Cy5, pseudo-colored as pink) staining.
