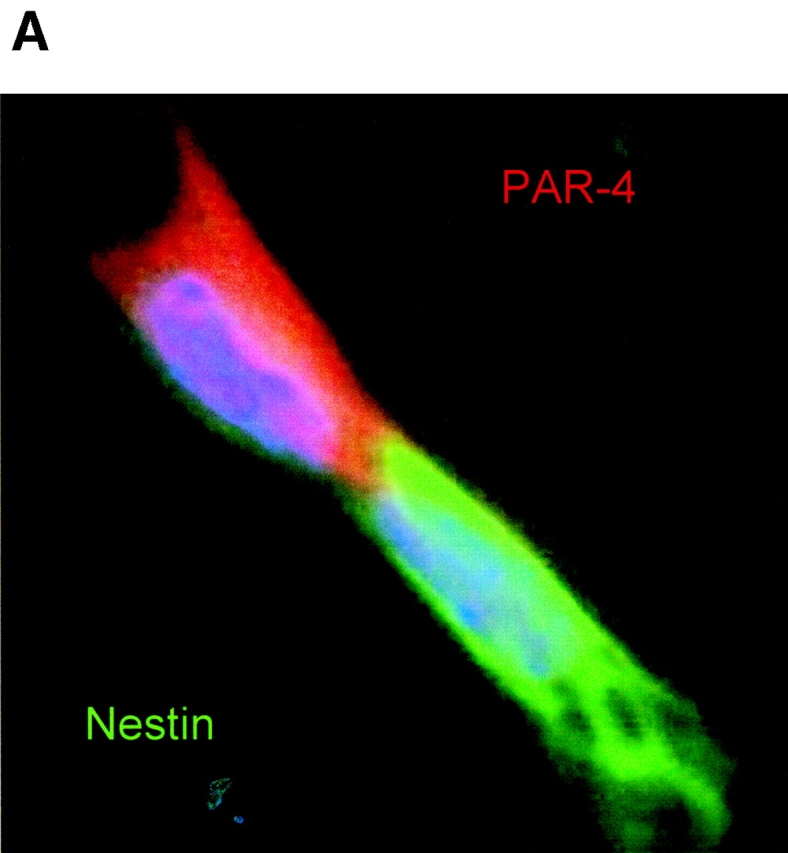
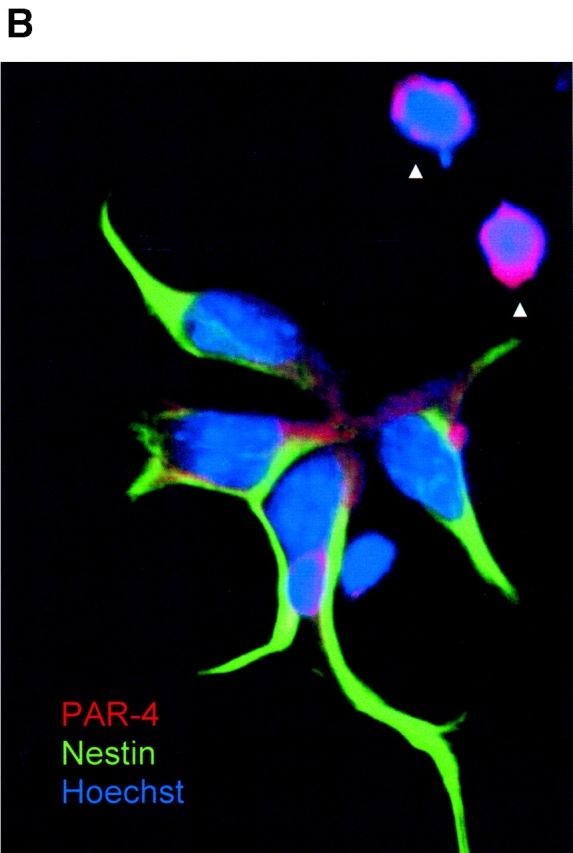
Figure 9.


Distribution of PAR-4 and nestin during cell division of ES-J1 ES cells at NP2 stage of differentiation. Multiple, indirect immunofluorescence staining of differentiating ES-J1 cells 48 h on replating of EB8 cells (NP2 stage). PAR-4, (Alexa® 546, red); nestin, (Alexa® 488, green); Hoechst (blue). (A) Mitotic cell in anaphase/telophase, overlay of PAR-4, nestin, and Hoechst staining. Note the strict asymmetric distribution of PAR-4 and nestin. (B) Cluster of neuroprogenitor cells, overlay of PAR-4, nestin, and Hoechst staining. Arrowheads indicate two apoptotic PAR-4–positive cells that did not show any expression of nestin.
