Figure 2.
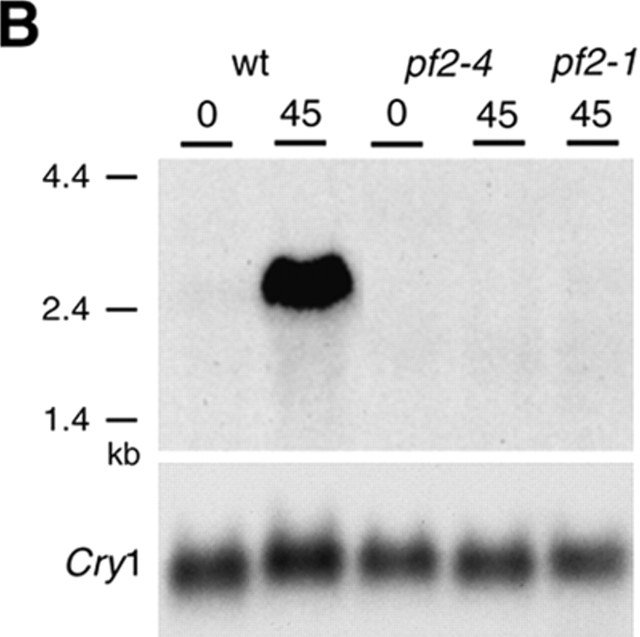
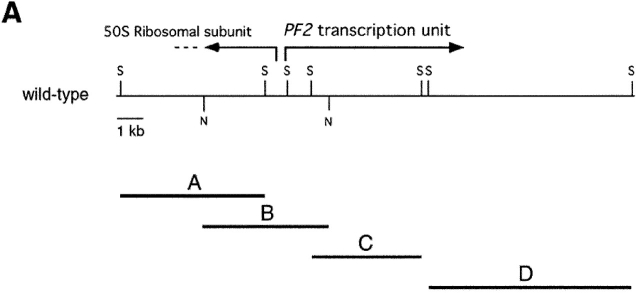
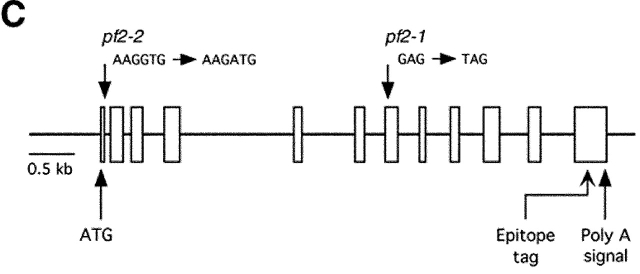
Analysis of the PF2 transcription unit. (A) Partial restriction map of wild-type genomic DNA in the region of the PF2 transcription unit. Also shown are selected SacI fragments (A, C, and D) and a NotI fragment (B) that were used to map the boundaries of the plasmid insertion and determine the size of the transcription unit. (B) Northern blot loaded with total RNA isolated from wild-type (wt) and pf2 mutant cells before (0) and 45 min after deflagellation. This blot was hybridized with probe C, which recognized an ∼2.5-kb transcript that is up-regulated in wild-type cells and missing in pf2 mutants. (B, bottom) Loading control. The blot was rehybridized with a CRY1 probe, which encodes the ribosomal S14 protein subunit (Nelson et al., 1994). (C) Diagram of the intron–exon structure of the PF2 transcription unit. Open rectangles indicate exons and solid lines indicate introns. The predicted translation start (ATG) site and the putative polyadenylation signal (Poly A) are indicated. Also shown are the single nucleotide alterations that resulted in the pf2-1 and pf2-2 mutations, and the location of the epitope tag in exon 12.


